SAT Exam  >  SAT Tests  >  Command Of Evidence Test-1 - SAT MCQ

Command Of Evidence Test-1 - SAT MCQ


Test Description

5 Questions MCQ Test - Command Of Evidence Test-1

Command Of Evidence Test-1 for SAT 2024 is part of SAT preparation. The Command Of Evidence Test-1 questions and answers have been prepared according to the SAT exam syllabus.The Command Of Evidence Test-1 MCQs are made for SAT 2024 Exam. Find important definitions, questions, notes, meanings, examples, exercises, MCQs and online tests for Command Of Evidence Test-1 below.
Solutions of Command Of Evidence Test-1 questions in English are available as part of our course for SAT & Command Of Evidence Test-1 solutions in Hindi for SAT course. Download more important topics, notes, lectures and mock test series for SAT Exam by signing up for free. Attempt Command Of Evidence Test-1 | 5 questions in 10 minutes | Mock test for SAT preparation | Free important questions MCQ to study for SAT Exam | Download free PDF with solutions
Command Of Evidence Test-1 - Question 1

The share of the world's population living in cities has increased dramatically since 1970, but this change has not been uniform. France and Japan, for example, were already heavily urbanized in 1970, with 70% or more of the population living in cities. The main contributors to the world's urbanization since 1970 have been countries like Algeria, whose population went from ______
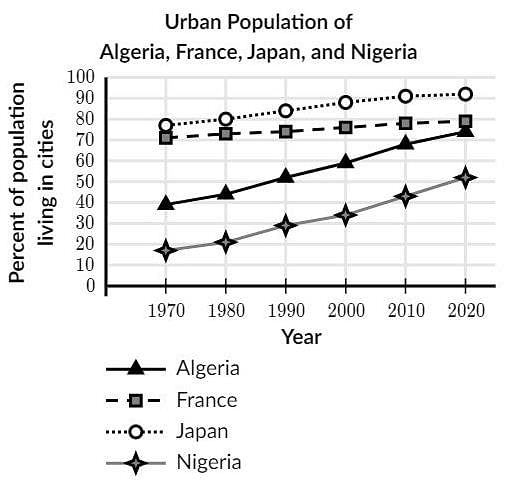
Which choice most effectively uses data from the graph to complete the assertion?

Detailed Solution for Command Of Evidence Test-1 - Question 1

This graph contains a lot of information, as does the paragraph. Let's simplify things by focusing on just the sentence we've been asked to complete:

The main contributors to the world's urbanization since 1970 have been countries like Algeria, whose population went from ______

So while the graph offers information about several countries, we only need to find data about Algeria.

A quick glance at the choices shows that we're looking to compare the data for Algeria in two years: 1970 and 2020.

The key to the graph shows us that Algeria's data is marked by a triangle and a solid line. According to the graph:

Algeria's urban population in 1970 looks to be around 40%

Algeria's urban population in 2020 looks to be around 75%

Only choice C accurately reflects this data. Choice C is the answer.

Command Of Evidence Test-1 - Question 2

Investigative journalists research and report about fraud, corruption, public hazards, and more. The graph shows the number of investigative articles published in the Albuquerque Journal newspaper from 2010 to 2019. According to an analyst, although the number of investigative articles published in this newspaper has varied significantly over the period shown, the number overall has fallen since 2010.
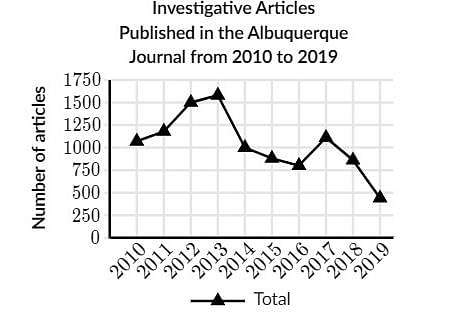
Which choice most effectively uses data from the graph to justify the underlined claim?

Detailed Solution for Command Of Evidence Test-1 - Question 2

Choice A. This is the best choice. By comparing the number of investigative articles in 2010 to the number in 2019, we can see that the number has fallen overall.

Choice B. This choice misreads the graph. The 1,600 articles published in 2013 was the largest annual number of investigative articles published during the period. Also, notice that the claim focuses on an overall change, while this choice just focuses on one year. We can't determine an overall increase or decrease by looking at just one year.

Choice C. This choice misreads the graph. The 1,000 articles published in 2017 wasn't the largest number published during the period. Also, notice that the claim focuses on an overall change, while this choice just focuses on one year. We can't determine an overall increase or decrease by looking at just one year.

Choice D. This choice doesn't justify the claim. The claim is about a decrease in articles published between 2010 and 2019. This data shows an increase in articles published over a different period (2010-2013).

1 Crore+ students have signed up on EduRev. Have you? Download the App
Command Of Evidence Test-1 - Question 3

Correlations Between Congestion Ratings and Features of the Crowd in Raters' Immediate Vicinity

Researcher Xiaolu Jia and colleagues monitored individuals' velocity and the surrounding crowd density as a group of study participants walked through a space and navigated around an obstacle. Participants rated how congested it seemed before the obstacle, after the obstacle, and overall, and the researchers correlated those ratings with velocity and density. (Correlations range from ?1 to 1, with greater distance from 0 indicating greater strength). The researchers concluded that the correlations with velocity are stronger than those with density.

Which choice best describes data from the table that support the researchers' conclusion?

Detailed Solution for Command Of Evidence Test-1 - Question 3

Choice A. This choice doesn't support the conclusion. It makes an "apples to oranges" comparison by comparing density and velocity correlations across features instead of comparing them for each feature.

Choice B. This choice doesn't support the conclusion. It doesn't include the density correlations for comparison.

Choice C. This choice doesn't support the conclusion. The text tells us that the farther the correlation is from 0, the "stronger" it is: it doesn't matter for "strength" whether it's negative or positive.

Choice D. This is the best choice. The text tells us that the farther the correlation is from 0, the "stronger" it is (doesn't matter if it's negative or positive). The table shows that the correlations with velocity are farther from zero than the correlations with density, which supports the conclusion that the correlations with velocity are stronger.

Command Of Evidence Test-1 - Question 4

Average Nitrate and Phosphate Concentrations in Seawater after Volcanic Eruption
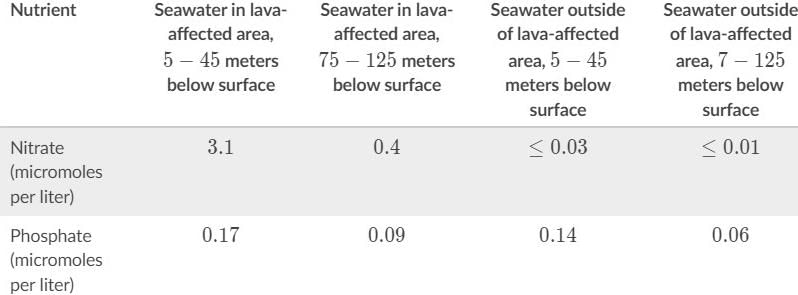
After a volcanic eruption spilled lava into North Pacific Ocean waters, a dramatic increase of diatoms (a kind of phytoplankton) near the surface occurred. Scientists assumed the diatoms were thriving on nutrients such as phosphate from the lava, but analysis showed these nutrients weren't present near the surface in forms diatoms can consume. However, there was an abundance of usable nitrate, a nutrient usually found in much deeper water and almost never found in lava. Microbial oceanographer Sonya Dyhrman and colleagues believe that as the lava plunged nearly 300 meters below the surface it dislodged pockets of this nutrient, releasing it to float upward, given that ______

Which choice most effectively uses data from the table to complete the statement?

Detailed Solution for Command Of Evidence Test-1 - Question 4

Choice A. This choice doesn't complete the statement in a way that supports the claim. The claim is about nitrate, not phosphate.

Choice B. This is the best choice. The claim is that the lava freed the deep nitrate, allowing it to float upward. The table supports this by showing that there was more nitrate in the lava-affected seawater at various depths above 300 meters (the depth to which the lava plunged) than in unaffected seawater.

Choice C. This choice doesn't complete the statement in a way that supports the claim. The claim is only about nitrate-the concentrations of phosphate aren't relevant.

Choice D. This choice doesn't complete the statement in a way that supports the claim. It doesn't say anything about the seawater inside the lava-affected area.

Command Of Evidence Test-1 - Question 5

Comfort Ratings and Temperature-Adjustment Preferences from One Survey

Nan Gao and her team conducted multiple surveys to determine participants' levels of comfort in a room where the temperature was regulated by a commercial climate control system. Participants filled out surveys several times a day to indicate their level of comfort on a scale from ?3 (very cold) to +3 (very hot), with 0 indicating neutral (neither warm nor cool), and to indicate how they would prefer the temperature to be adjusted. The table shows three participants' responses in one of the surveys. According to the table, all three participants wanted the room to be cooler, ______

Which choice most effectively uses data from the table to complete the statement?

Detailed Solution for Command Of Evidence Test-1 - Question 5

Choice A. This choice misreads the table. Participant 1 and participant 21 reported the same level of comfort, but participant 20's comfort level was three points lower.

Choice B. This choice doesn't use data from the table. The table only shows us one survey, so we don't know if the participants' ratings varied throughout the day.

Choice C. This is the best choice. The text describes the comfort rating scale: from ?3 (very cold) to +3 (very hot), with 0 being neutral. Participant 20 gave a -2 comfort rating, a full three points colder on the scale than the other two participants.

Choice D. This choice misreads the table. Participant 1 and participant 21 reported the same level of comfort.

Information about Command Of Evidence Test-1 Page
In this test you can find the Exam questions for Command Of Evidence Test-1 solved & explained in the simplest way possible. Besides giving Questions and answers for Command Of Evidence Test-1, EduRev gives you an ample number of Online tests for practice

Top Courses for SAT

Download as PDF

Top Courses for SAT