SAT Exam  >  SAT Tests  >  Command Of Evidence Test-2 - SAT MCQ

Command Of Evidence Test-2 - SAT MCQ


Test Description

5 Questions MCQ Test - Command Of Evidence Test-2

Command Of Evidence Test-2 for SAT 2024 is part of SAT preparation. The Command Of Evidence Test-2 questions and answers have been prepared according to the SAT exam syllabus.The Command Of Evidence Test-2 MCQs are made for SAT 2024 Exam. Find important definitions, questions, notes, meanings, examples, exercises, MCQs and online tests for Command Of Evidence Test-2 below.
Solutions of Command Of Evidence Test-2 questions in English are available as part of our course for SAT & Command Of Evidence Test-2 solutions in Hindi for SAT course. Download more important topics, notes, lectures and mock test series for SAT Exam by signing up for free. Attempt Command Of Evidence Test-2 | 5 questions in 10 minutes | Mock test for SAT preparation | Free important questions MCQ to study for SAT Exam | Download free PDF with solutions
Command Of Evidence Test-2 - Question 1

To understand how expressions of anger in reviews of products affect readers of those reviews, business scholar Dezhi Yin and colleagues measured study participants' responses to three versions of the same negative review—a control review expressing no anger, a review expressing a high degree of anger, and a review expressing a low degree of anger. Reviewing the data, a student concludes that the mere presence of anger in a review may not negatively affect readers' perceptions of the review, but a high degree of anger in a review does worsen readers' perceptions of the review.
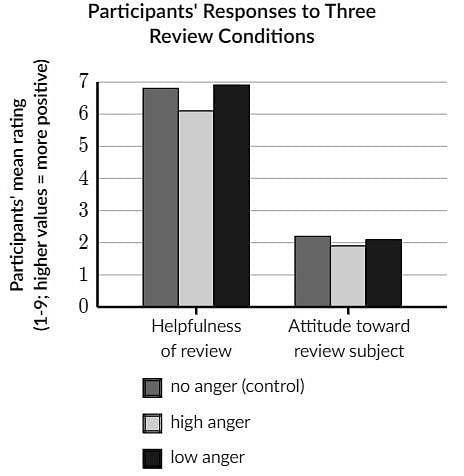
Which choice best describes data from the graph that support the student's conclusion?

Detailed Solution for Command Of Evidence Test-2 - Question 1

Choice A. This choice does not support the conclusion. The conclusion is only about how participants feel about the review itself-the participants' ratings of the reviewed product are not relevant.

Choice B. This is the best choice. The claim is that low anger does not negatively affect readers' perceptions of the review, while high anger does negatively affect readers' perceptions of the review. This choice accurately expresses the supporting data from the "helpfulness of review" part of the graph: that low-anger reviews were rated as slightly more helpful than no-anger reviews, while high-anger reviews were rated as less helpful than no-anger reviews.

Choice C. This choice does not support the conclusion. The conclusion is only about how participants feel about the review itself-the participants' attitude towards the reviewed product is not relevant.

Choice D. This choice does not support the conclusion. The conclusion is only about how participants feel about the review itself-the participants' attitude towards the reviewed product is not relevant.

Command Of Evidence Test-2 - Question 2

To monitor changes to glaciers in Switzerland, the government periodically measures them for features like total area of ice and mean ice thickness, which are then reported in the Swiss Glacier Inventory. These measurements can be used to compare the glaciers. For example, the Gorner glacier had ______
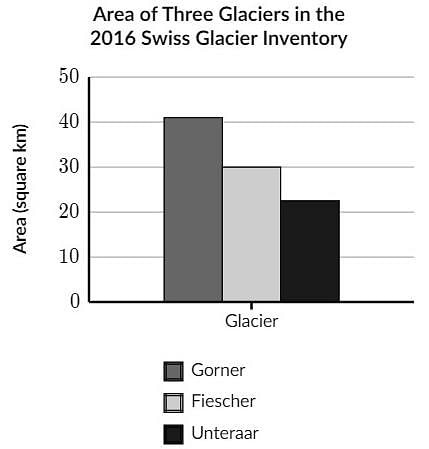
Which choice most effectively uses data from the graph to complete the example?

Detailed Solution for Command Of Evidence Test-2 - Question 2

Choice A. This is the best choice. The claim is that measurements such as total area can be used to compare glaciers. The graph shows us the area measurements for three glaciers. Of those, Gorner has the largest area.

Choice B. This choice misreads the graph. The graph shows that Gorner has the largest area of the three.

Choice C. This choice misreads the graph. The graph shows that Gorner has the largest area of the three.

Choice D. This choice misreads the graph. The graph shows that Gorner has the largest area of the three.

1 Crore+ students have signed up on EduRev. Have you? Download the App
Command Of Evidence Test-2 - Question 3

In the United States, firms often seek incentives from municipal governments to expand to those municipalities. A team of political scientists hypothesized that municipalities are much more likely to respond to firms and offer incentives if expansions can be announced in time to benefit local elected officials than if they can't. The team contacted officials in thousands of municipalities, inquiring about incentives for a firm looking to expand and indicating that the firm would announce its expansion on a date either just before or just after the next election.
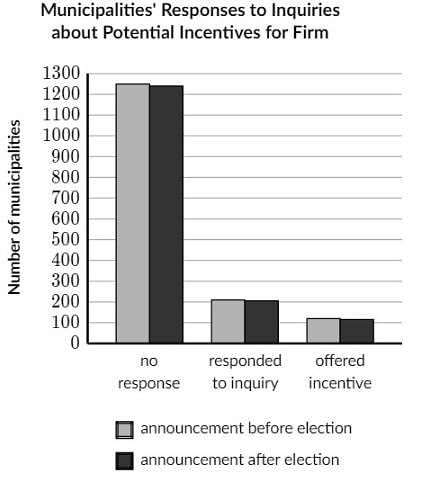
Which choice best describes data from the graph that weaken the team's hypothesis?

Detailed Solution for Command Of Evidence Test-2 - Question 3

Choice A. This accurately describes some data from the graph, but it doesn't weaken the hypothesis. It doesn't include the "announcement after election" data for comparison.

Choice B. This is the best choice. The lighter bars show what happened when the announcement was to come before the election, and the darker bars show what happened when the announcement was to come after the election. For all three of the outcomes, the light and dark bars are virtually the same, demonstrating that the announcement timing didn't actually make a difference.

Choice C. This accurately describes some data from the graph, but it doesn't weaken the hypothesis. It doesn't include the "announcement after election" data for comparison.

Choice D. This accurately describes some data from the graph, but it doesn't weaken the hypothesis. It doesn't include the "announcement before election" data for comparison.

Command Of Evidence Test-2 - Question 4

To investigate the influence of certain estrogen-responsive neurons on energy expenditure, biologist Stephanie Correa et al. treated female and male mice with either saline solution or clozapine-N4-oxide (CNO), which activates the neurons. Monitoring the activity levels of the mice by measuring how frequently the animals broke infrared beams crossing their enclosures, Correa et al. found that the mice in their study showed sex-specific differences in response to neuron activation: ______
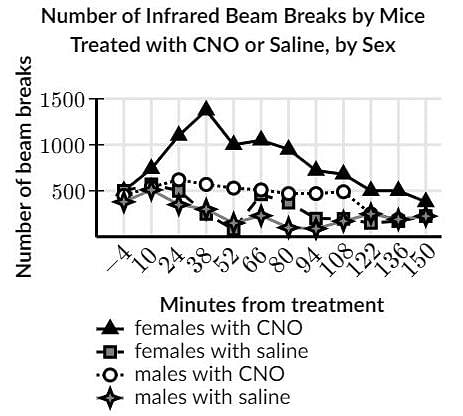
Which choice most effectively uses data from the graph to complete the assertion?

Detailed Solution for Command Of Evidence Test-2 - Question 4

Choice A. This choice misreads the graph. All four groups of mice started at nearly the same activity level before treatment (see how all four points are very close together at -4 minutes, meaning four minutes before treatment).

Choice B. This choice misreads the graph. The line for the CNO-treated males does not show a "substantial decline" until around 122 minutes, and there is no "steep increase" afterward.

Choice C. This choice doesn't complete the assertion. The assertion is about the mice's response to neuron activation, so we need to include the data about the CNO-treated females and males.

Choice D. This is the best choice. The graph shows that the CNO-treated females were way more active than the CNO-treated males, while the saline-treated males and females (the control groups) had very similar activity levels. This supports the claim that there were sex-specific differences in the mice's response to neuron activation.

Command Of Evidence Test-2 - Question 5

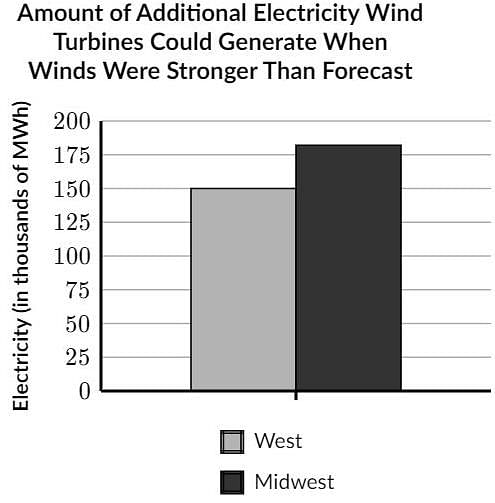
Electric companies that use wind turbines rely on weather forecasts to predict the maximum amount of power, in megawatt-hours (MWh), they can generate using wind so that they can determine how much they'll need to generate from other sources. When winds are stronger than they were forecast to be, however, the predicted maximum amount of electricity wind turbines could generate will be too low. For example, the graph shows that for the West region, the winds were ______
Which choice most effectively uses data from the graph to complete the example?

Detailed Solution for Command Of Evidence Test-2 - Question 5

Choice A. This is the best choice. The claim is that when winds are stronger than forecasted, wind turbines can generate more energy than predicted. The supporting graph shows the additional amount (above the predicted amount) that the turbines generated under those conditions, with the West generating about 150 thousand additional MWh.

Choice B. This choice doesn't complete the example. The graph shows the additional amount of electricity that the wind turbines generated. The West bar is greater than 0, so the West generated more than the predicted amount.

Choice C. This choice doesn't complete the example. The graph shows the additional amount of electricity that the wind turbines generated. The West bar is greater than 0, so the West generated more than the predicted amount.

Choice D. This choice misreads the graph. The graph shows us that the West (the bar on the left) generated about 150 thousand additional MWh.

Information about Command Of Evidence Test-2 Page
In this test you can find the Exam questions for Command Of Evidence Test-2 solved & explained in the simplest way possible. Besides giving Questions and answers for Command Of Evidence Test-2, EduRev gives you an ample number of Online tests for practice

Top Courses for SAT

Download as PDF

Top Courses for SAT