CTET & State TET Exam  >  CTET & State TET Tests  >  Test: Data Handling - 2 - CTET & State TET MCQ

Test: Data Handling - 2 - CTET & State TET MCQ


Test Description

20 Questions MCQ Test - Test: Data Handling - 2

Test: Data Handling - 2 for CTET & State TET 2024 is part of CTET & State TET preparation. The Test: Data Handling - 2 questions and answers have been prepared according to the CTET & State TET exam syllabus.The Test: Data Handling - 2 MCQs are made for CTET & State TET 2024 Exam. Find important definitions, questions, notes, meanings, examples, exercises, MCQs and online tests for Test: Data Handling - 2 below.
Solutions of Test: Data Handling - 2 questions in English are available as part of our course for CTET & State TET & Test: Data Handling - 2 solutions in Hindi for CTET & State TET course. Download more important topics, notes, lectures and mock test series for CTET & State TET Exam by signing up for free. Attempt Test: Data Handling - 2 | 20 questions in 20 minutes | Mock test for CTET & State TET preparation | Free important questions MCQ to study for CTET & State TET Exam | Download free PDF with solutions
Test: Data Handling - 2 - Question 1

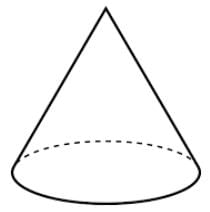
Which solid shape has 1 flat face and 1 curved face

Detailed Solution for Test: Data Handling - 2 - Question 1

The cup of cone is curved and the base of cone is flat . So it has 1 curved and 1 flat surface.
So option A is correct.

Test: Data Handling - 2 - Question 2

The information presented in the form of name and number is called _____________.

Detailed Solution for Test: Data Handling - 2 - Question 2

Data represent information in form of names and numbers.

1 Crore+ students have signed up on EduRev. Have you? Download the App
Test: Data Handling - 2 - Question 3

The next number in the sequence is 6, 8, 10, 12

Detailed Solution for Test: Data Handling - 2 - Question 3

The Sequence is 6, 8, 10, 12, 14

Test: Data Handling - 2 - Question 4

When pictures are used to represent information it is know as ________.

Detailed Solution for Test: Data Handling - 2 - Question 4

Pictorial representations are called pictographs.

Test: Data Handling - 2 - Question 5

What is written at the top of the pictograph?

Detailed Solution for Test: Data Handling - 2 - Question 5

Title tells what a pictograph represents. 

Test: Data Handling - 2 - Question 6

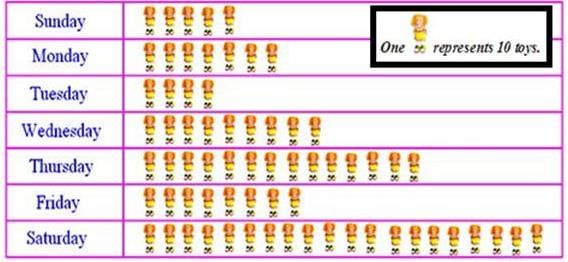
On which day were the maximum numbers of toys sold?

Detailed Solution for Test: Data Handling - 2 - Question 6

We can clearly see that the maximum toys sold were on Saturday. 

Test: Data Handling - 2 - Question 7

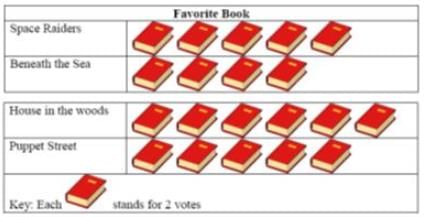
How many children in all voted for Space Raiders and Puppet Street?
Detailed Solution for Test: Data Handling - 2 - Question 7

Since one b ook stand for 2 votes, the total votes for Space Raiders are 10 and for puppet street are also 10. 

Hence, in total 20

Test: Data Handling - 2 - Question 8

Directions: Given bar graph represents the number of students of different classes of a school who  participated in a competition.
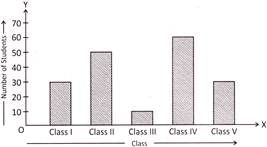
Study the bar graph and answer the question below:

How many students in total, of all five classes participated in the competition?

Detailed Solution for Test: Data Handling - 2 - Question 8

Explanation: Option (d) is correct. Total number of students who participated in the competition: =30+50+10+60+30=180

Test: Data Handling - 2 - Question 9

From the following graph determine which year faced maximum price rise in India in comparison to the preceding are:
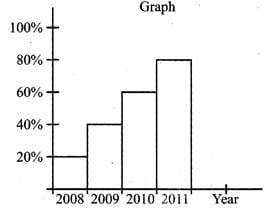
Detailed Solution for Test: Data Handling - 2 - Question 9

In 2009, maximum price rise = 
In 2010, maximum price rise = 
In 2011, maximum price rise = 

So. Maximum price rise in India in comparison to the preceding year is 2009

Test: Data Handling - 2 - Question 10

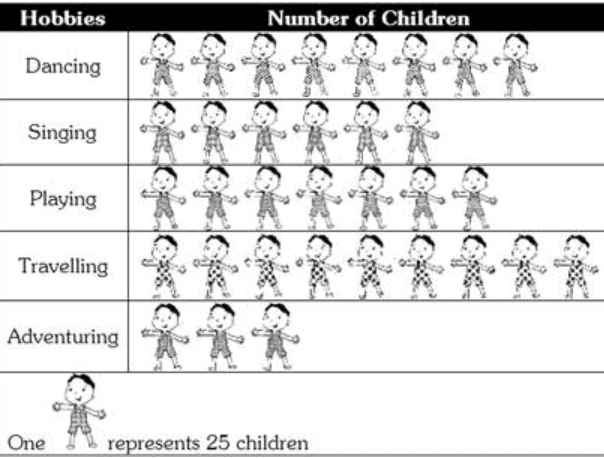
How many children are there whose hobby is adventuring?

Detailed Solution for Test: Data Handling - 2 - Question 10

 3 × 25 = 75. There are 75 children whose hobby is adventuring.

Test: Data Handling - 2 - Question 11

What is written at the bottom of the pictograph?

Detailed Solution for Test: Data Handling - 2 - Question 11

Key tells us how many items of data each symbol represents.

Test: Data Handling - 2 - Question 12

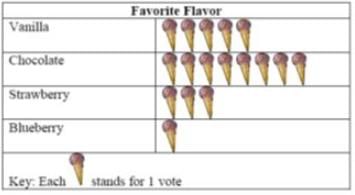
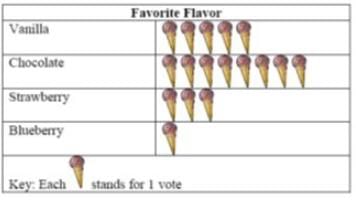
Which flavor got 5 votes?

Detailed Solution for Test: Data Handling - 2 - Question 12

Vanilla got 5 votes. 

Test: Data Handling - 2 - Question 13

How many children voted?

Detailed Solution for Test: Data Handling - 2 - Question 13

In total, 17 children voted because one cone stands for one vote; so we will count all the cones. 

Test: Data Handling - 2 - Question 14

A _________ is a representation of numbers using bars of uniform widths.

Detailed Solution for Test: Data Handling - 2 - Question 14

A Bar graph is a representation of numbers using bars of uniform width and the lengths of the bars depend upon the frequency and the scale you have chosen.

Bar graph A bar graph is a representation of numbers using bars of uniform  width and the lengths of the bars depend upon the frequency and the scale  you have chosen. It is a method of representing data visually. In the case  of bar graph or bar diagram ...

Test: Data Handling - 2 - Question 15

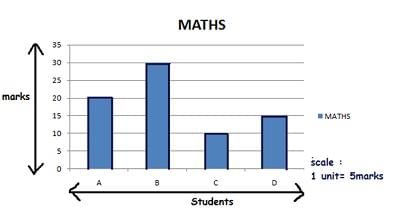
The bar graph shows the grades obtained by a group of pupils in a test.
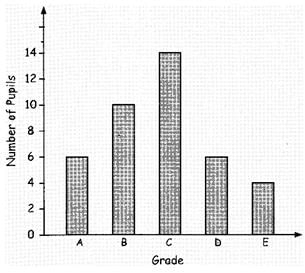
If grade C is the passing mark, how many pupils passed the test?

Detailed Solution for Test: Data Handling - 2 - Question 15

Number of pupils passed by grade c are 14

Test: Data Handling - 2 - Question 16

The mode of a set of observations is the value which

Detailed Solution for Test: Data Handling - 2 - Question 16

By definition, mode is the value which occurs most frequently.
The mode of a set of observations is the value that appears most frequently in the data set. To find the mode, count how many times each number appears in the data set and the number that appears the most is the mode. 

Test: Data Handling - 2 - Question 17

If, ↑ represents 5 houses, then the number of houses represented by↑↑↑↑ are:

Detailed Solution for Test: Data Handling - 2 - Question 17

 5 × 4

Test: Data Handling - 2 - Question 18

Tally marks are ____________lines.

Detailed Solution for Test: Data Handling - 2 - Question 18

Tally marks are vertical lines marked as (|)

Test: Data Handling - 2 - Question 19

Directions (Q. 40): Mona went for Diwali shopping with her parents and brother Raj. Mona made following list of items that they wanted to purchase-  Mona's friends Rupali came to her house and requested Mona to give her 10 candles and 10 diyas, as she could not go to market for shopping due to her mother's sickness. According to you what Mona should do?
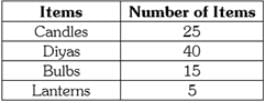
Detailed Solution for Test: Data Handling - 2 - Question 19

It is Mona's moral duty to help Rupali as her mother is sick.

Test: Data Handling - 2 - Question 20

In interpreting data, we draw conclusions from the ___________.

Detailed Solution for Test: Data Handling - 2 - Question 20

We take decisions from the data.

Information about Test: Data Handling - 2 Page
In this test you can find the Exam questions for Test: Data Handling - 2 solved & explained in the simplest way possible. Besides giving Questions and answers for Test: Data Handling - 2, EduRev gives you an ample number of Online tests for practice

Top Courses for CTET & State TET

Download as PDF

Top Courses for CTET & State TET