Test: Venn Diagrams- 3 - CAT MCQ
10 Questions MCQ Test - Test: Venn Diagrams- 3

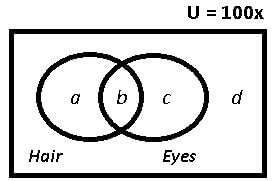
In a certain town, 40% of people have brown hair, 30% of people have brown eyes and 12% have both brown hair and brown eyes. How many people in town have neither brown hair nor brown eyes?
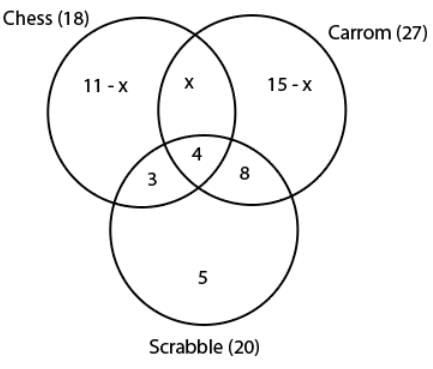
Each student in a class of 40 plays at least one indoor game-chess, carom and scrabble. 18 play chess, 20 play scrabble and 27 play carom. 7 play both chess and scrabble, 12 play both scrabble and carom and 4 play all 3 games. The number of players who play chess and carom but not scrabble is

Read the information given below and answer the 2 associated questions.
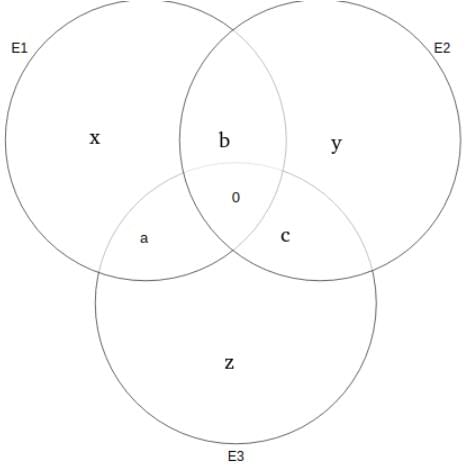
190 students have to choose at least one elective and at most two electives from a list of three electives: E1, E2 and E3. It is found that the number of students choosing E1 is half the number of students choosing E2, and one third the number of students choosing E3.
Moreover, the number of students choosing two electives is 50.
In addition to the given information, which of the following information is NECESSARY and SUFFICIENT to compute the number of students choosing only E1, only E2 and only E3?
Moreover, the number of students choosing two electives is 50.
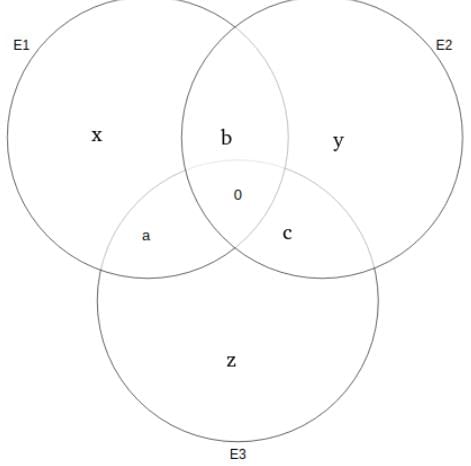
Read the information given below and answer the 2 associated questions.
190 students have to choose at least one elective and at most two electives from a list of three electives: E1, E2 and E3. It is found that the number of students choosing E1 is half the number of students choosing E2, and one third the number of students choosing E3.
Moreover, the number of students choosing two electives is 50.
Which of the following CANNOT be obtained from the given information?
The number of people (in lakhs) who read only one newspaper is
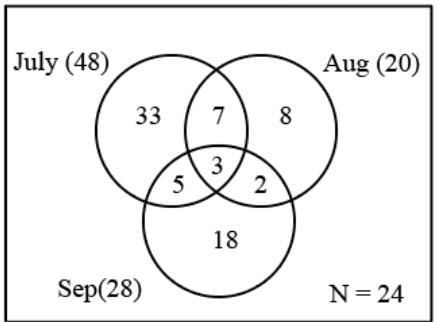
A survey was conducted of 100 people whether they have read recent issues of ‘Golmal’, a monthly magazine. Summarized information is presented below :
Only September: 18
September but not August: 23
September and July: 8
September: 28
July: 48
July and August: 10
None of the three months: 24
What is the number of surveyed people who have read exactly for two consecutive months?
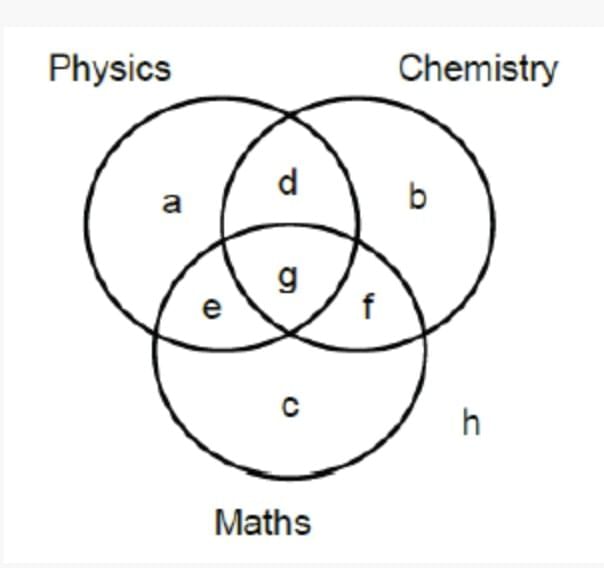
Applicants for the doctoral programmes of Ambi Institute of Engineering (AIE) and Bambi Institute of Engineering (BIE) have to appear for a Common Entrance Test (CET). The test has three sections: Physics (P), Chemistry (C), and Maths (M). Among those appearing for CET, those at or above the 80th percentile in at least two sections, and at or above the 90th percentile overall, are selected for Advanced Entrance Test (AET) conducted by AIE. AET is used by AIE for final selection. For the 200 candidates who are at or above the 90th percentile overall based on CET, the following are known about their performance in CET:
1. No one is below the 80th percentile in all 3 sections.
2. 150 are at or above the 80th percentile in exactly two sections.
3. The number of candidates at or above the 80th percentile only in P is the same as the number of candidates at or above the 80th percentile only in C. The same is the number of candidates at or above the 80th percentile only in M.
4. Number of candidates below 80th percentile in P: Number of candidates below 80th percentile in C: Number of candidates below 80th percentile in M = 4:2:1.
BIE uses a different process for selection. If any candidate is appearing in the AET by AIE, BIE considers their AET score for final selection provided the candidate is at or above the 80th percentile in P. Any other candidate at or above the 80th percentile in P in CET, but who is not eligible for the AET, is required to appear in a separate test to be conducted by BIE for being considered for final selection. Altogether, there are 400 candidates this year who are at or above the 80th percentile in P.
Question: What best can be concluded about the number of candidates sitting for the separate test for BIE who were at or above the 90th percentile overall in CET?
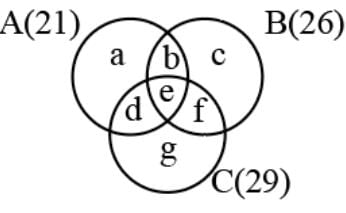
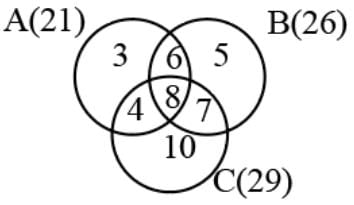
During the placement season of a class, 21 students got shortlisted for company A, 26 got shortlisted for Company B and 29 got shortlisted for company C and 14 students got shortlisted for both A and B, 12 students got shortlisted for A and C and 15 for both B and C. All the companies shortlisted 8 students from the class. Then what is the ratio of number of students who got shortlisted for only B and number of students who got shortlisted for only C?
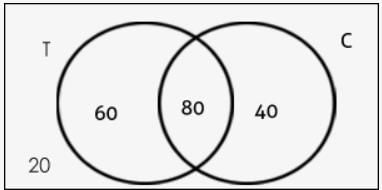
In a college, 200 students are randomly selected. 140 like tea, 120 like coffee, and 80 like both tea and coffee.
- How many students like at least one of the beverages?
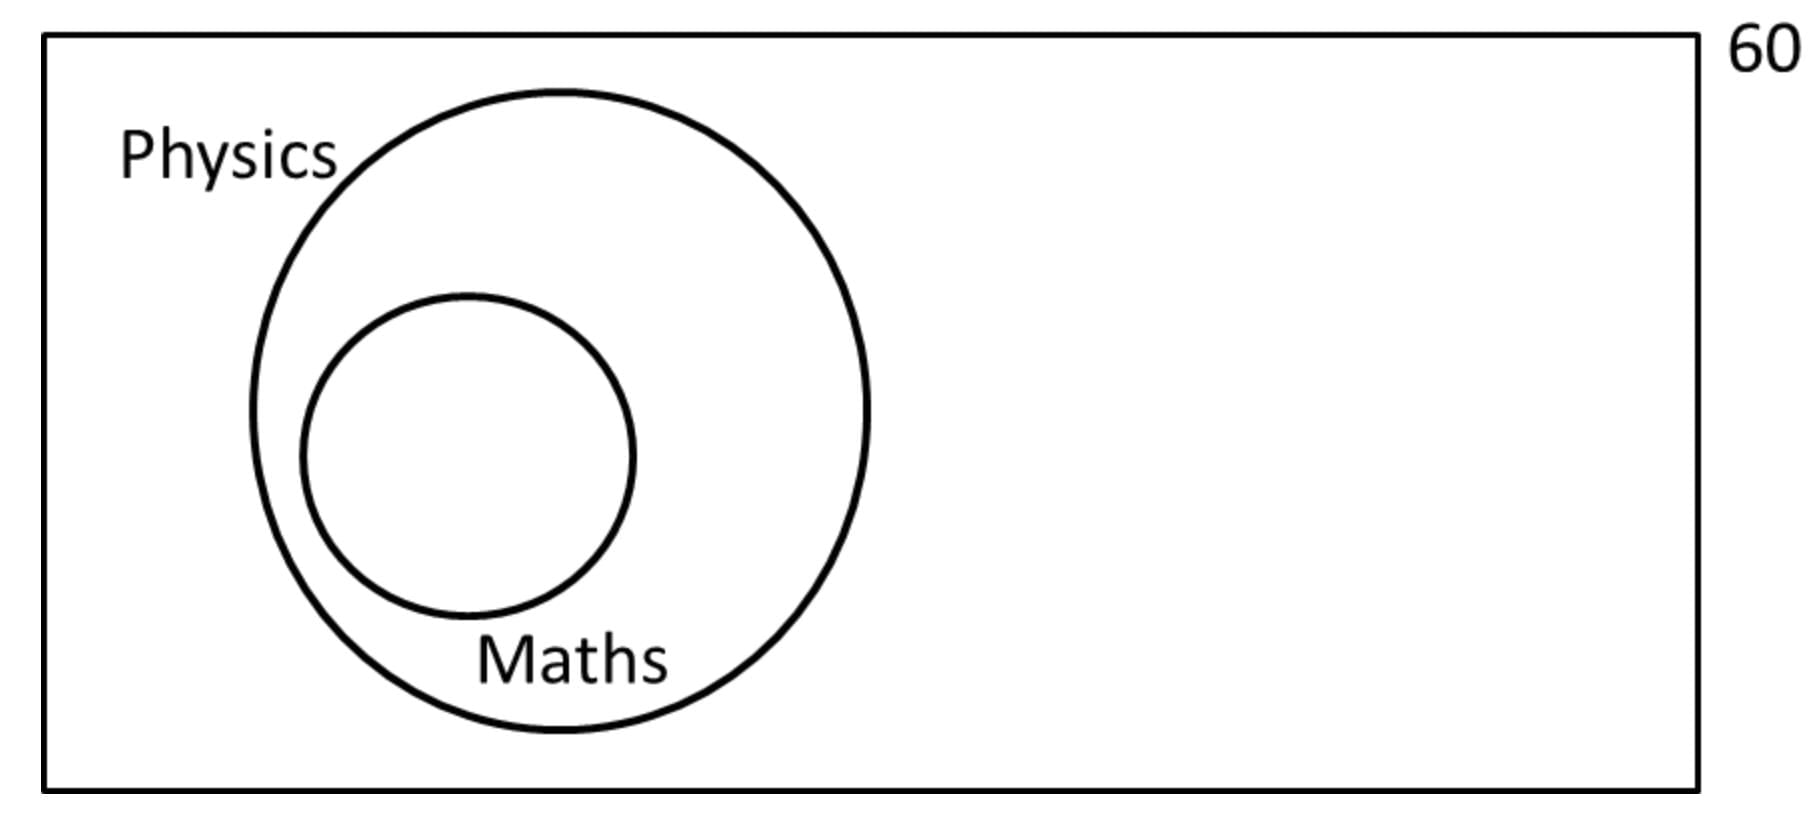
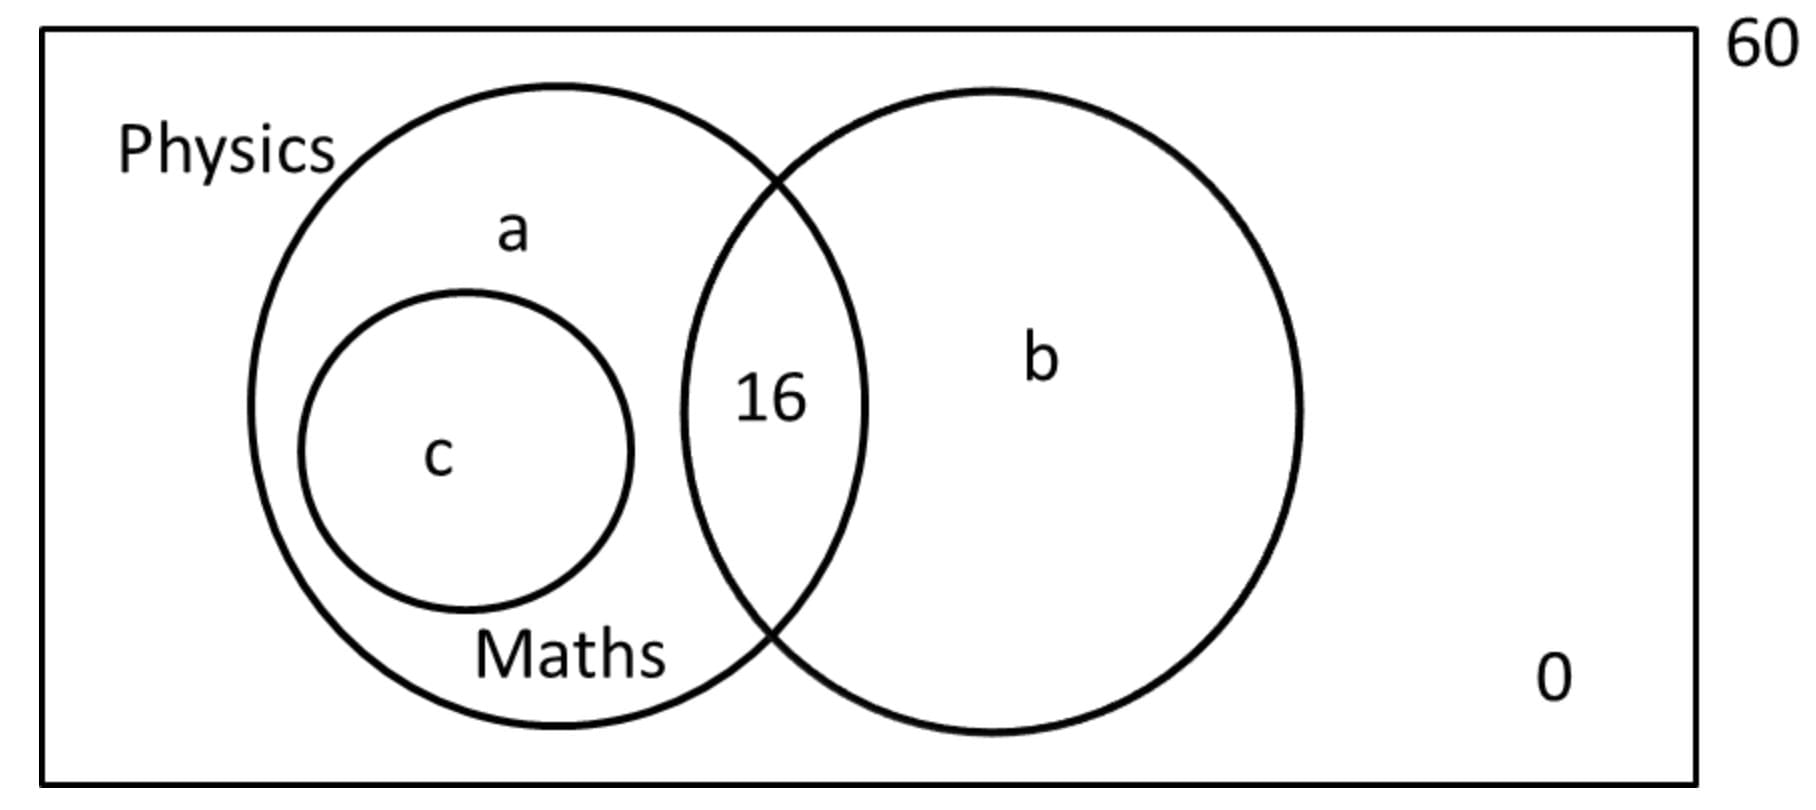
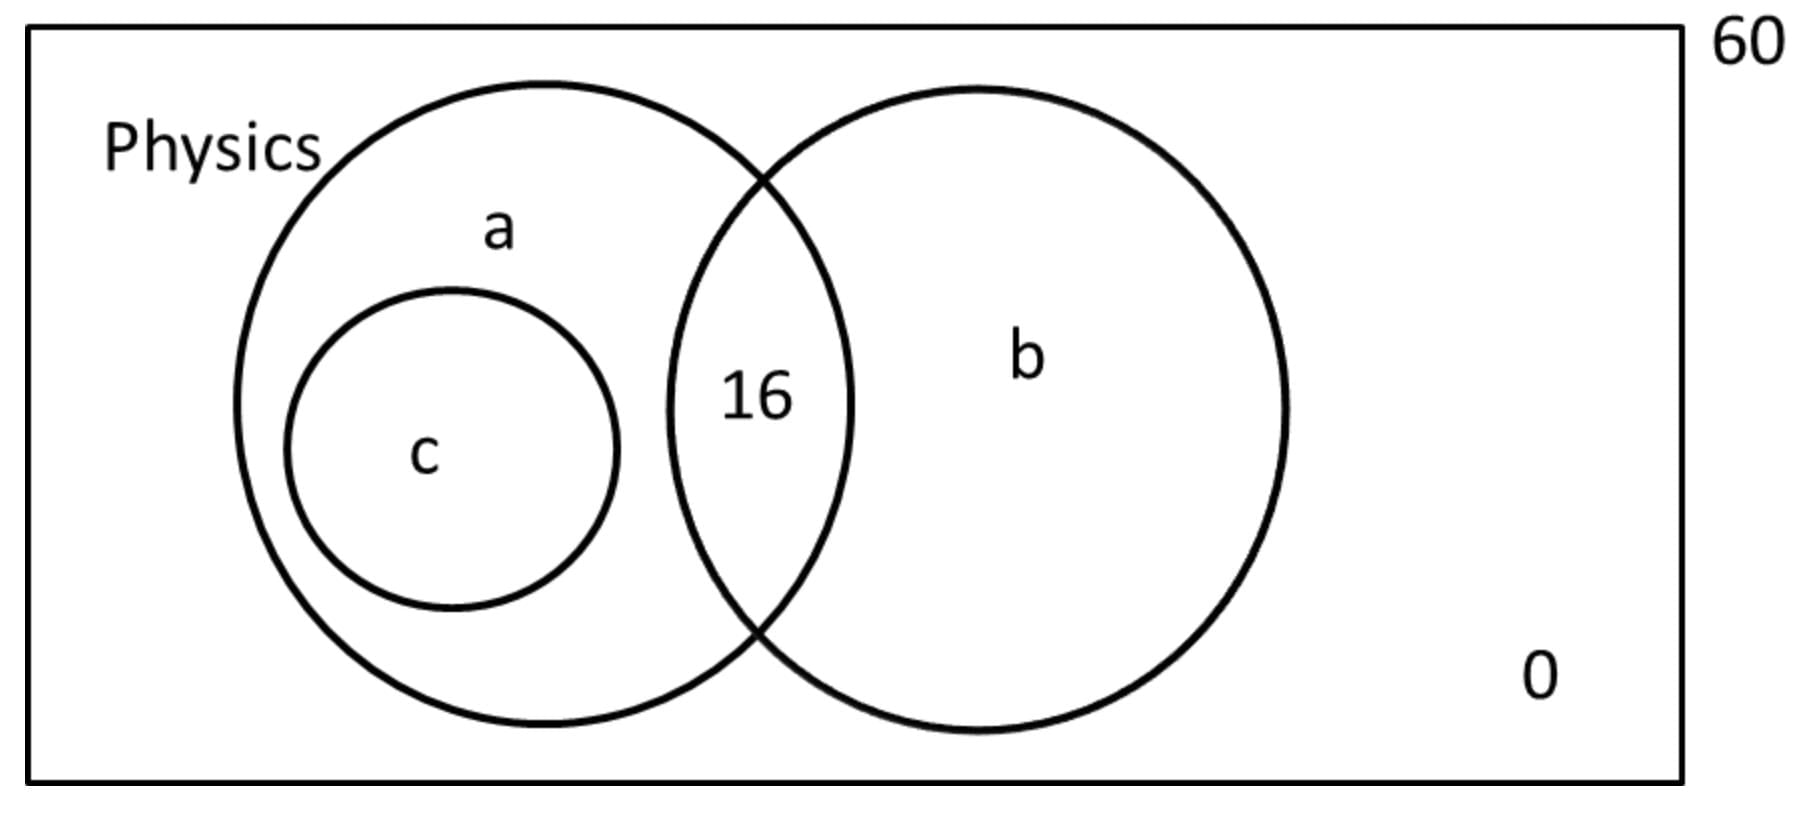
Of 60 students in a class, anyone who has chosen to study maths elects to do physics as well. But no one does maths and chemistry, 16 do physics and chemistry. All the students do at least one of the three subjects and the number of people who do exactly one of the three is more than the number who do more than one of the three. What are the maximum and minimum number of people who could have done Chemistry only?


Important Questions for Venn Diagrams- 3
Venn Diagrams- 3 MCQs with Answers
Online Tests for Venn Diagrams- 3
|
© EduRev
|
Education Revolution
|


|


