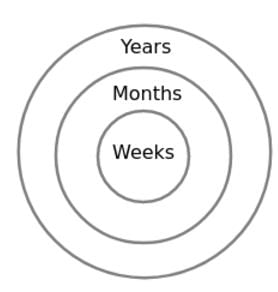
Test: SSC CGL Previous Year Questions: Venn Diagram (2020-19) - SSC CGL MCQ
30 Questions MCQ Test - Test: SSC CGL Previous Year Questions: Venn Diagram (2020-19)
Select the venn diagram that best illustrates the relationship between the following classes. [CGL 04/06/2019 Morning]
Uncle, Relatives, Rich.
Uncle, Relatives, Rich.
Select the Venn diagram that best illustrates the relationship between the following classes. [CGL 04/06/2019 afternoon]
Parents, Rich Persons, Farmers.
Parents, Rich Persons, Farmers.
| 1 Crore+ students have signed up on EduRev. Have you? Download the App |
Select the Venn Diagram that best illustrates the relationship between the following classes. [CGL 04/06/2019 Evening]
Graduates , Literates and Hardworking.
Graduates , Literates and Hardworking.
Select the Venn diagram that illustrates the relationship between the following classes.[CGL 06/06/2019 Morning]
Snakes, Reptiles, Poisonous.
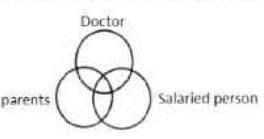
Select the Venn diagram that best illustrates the relationship between the following classes. [CGL 06/06/19 Afternoon]
Doctors/ Salaried Persons/ Parents.
Choose the Venn diagram that best illustrates the relationship among the following classes. [CGL 06/06/2019 Evening]
Women , Entrepreneurs , Engineers.
Choose the venn diagram that best illustrates the relationship among the following classes. [CGL 07/06/2019 Morning]
Crocodiles, Aquatic animals , Reptiles
elect the venn diagram that best illustrates the relationship between the following classes. [CGL 07/06/2019 Evening]
Villagers , Poor Persons , Males.
Select the venn diagram that best illustrates the relationship between the following classes. [CGL10/06/2019 Morning]
Indians , Females , Voters.
Which one of the following figures represents students, teachers and schools? [CGL 10/06/2019 Afternoon]
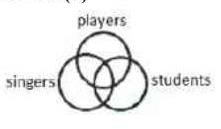
Which one of the following figures represents players, singers and students? [CGL 10/06/2019 Evening]

Which one of the following figures represents wheat, mustard and cabbage? [CGL 11/06/2019 Morning]
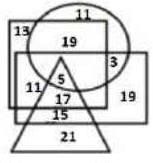
In the given venn diagram, the rectangle represents ‘Women’ , the pentagon represents ‘Entrepreneurs’ and the triangle represents ‘Mothers’. The number given in the diagram represents the number of persons in that particular category. [CGL 12/06/2019 Evening]
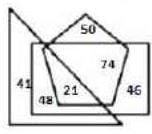
How many women are entrepreneurs but NOT mothers?
The given Venn diagram represents employees in an organisation The triangle represents executives, the circle represents females, the rectangle represents MBAs and the square represents technical staff. The numbers given in the diagram represent the number of persons in that particular category. [CGL 3/3/2020 Morning]
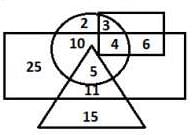
How many female executives are there in the organisation?
The given Venn diagram represents employees in an organisation The triangle represents ‘teachers’, the circle represents ‘ladies’, the rectangle represents ‘unmarried persons’. The numbers given in the diagram represent the number of persons in that particular category. [CGL 3/3/2020 Afternoon]
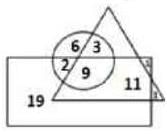
How many married ladies are teachers.
Thc given Venn diagram represents artists in a circus: The triangle represents Clowns, the circle represents acrobats, the rectanglerepresents males and the square represents ringmasters. The numbers given in the diagram represent the number of persons in that particular category. [CGL 4/3/2020 Morning]
How many male clowns are also ringmasters, but NOT acrobats.
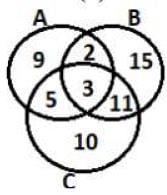
In the given Venn diagram ‘Group A’ represents those who can speak ‘English’, ‘Group B’ represents those who can speak ‘Hindi’, and ‘Group C’ represents those who can speak ‘Marathi’. The numbers given in the diagram represent the number of persons in that particular category. [CGL 4/3/2020 Afternoon]
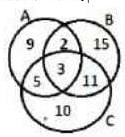
How many persons can speak exactly two languages?
In the given Venn diagram, the ‘rectangle’ represents ‘engineers’, the ‘circle’ represents ‘managers’, and the ‘triangle’ represents ‘married’. The numbers given the diagram represent the number of persons in that particular category. [CGL 4/3/2020 Evening]
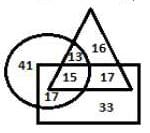
How many people arc married but NOT engineers?
In the given Venn diagram, the triangle represents students playing table tennis , the rectangle represents students playing badminton, the circle represents female students, and the pentagon represents students playing football. The numbers given in the diagram represent the number of person in the particular category. [CGL 5/3/2020 Morning]
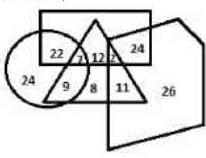
How many female students play both table tennis and badminton?
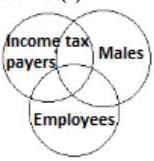
Which o f th e fo llo w in g Venn diagrams best represents the relationship between the following classes? [CGL 5/3/2020 Afternoon]
Income Tax payers/ Employees/ Males.
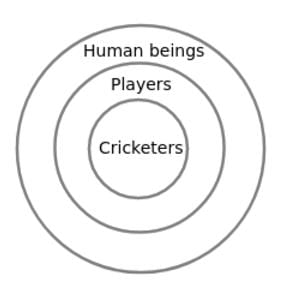
Which of thefollowing Venn diagrams best represents the relationship between the following classes? [CGL 5/3/2020 Evening]
Cricketers/Players/ Human beings.
In the given Venn diagram, the ‘rectangle’ represents ‘travellers who like to travel by plane’, the ‘circle’ represents ‘travellers who like to travel by bus’ , and the ‘triangle ‘represents travellers who like to travellers who like to travel by train’. The numbers given in the diagram represent the number of travellers in that particular category. [CGL 6/3/2020 Morning]
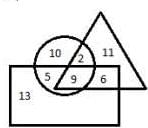
How many travellers like to travel cither by train or plane but NOT by bus?
Which of the following sets is best represented by the given Venn diagram ? [CGL 6/3/2020 Afternoon]
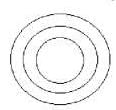
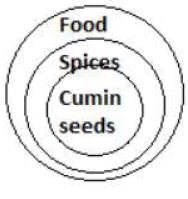
W hich o f th e fo llo w in g Venn diagrams best represents the relationship between the following classes? [CGL 6/3/2020 Evening]
Spices , Cumin seeds, Food
Thc given Venn diagram represents results of a class of students.[CGL 7/3/2020 Morning]
The triangle represents students who scored 85% and above in Maths, the circle represents students who scored 85% and above in English, the rectangle represents students who scored 85% and above in Science, and the square represents students who scored 85% and above in Social Sciences. The numbers given in the diagram represent the number of students in that particular category.
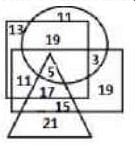
How many students scored 85% and above in all the subjects?
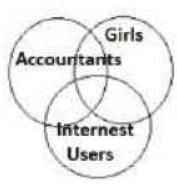
W hich o f the fo llo w in g Venn diagrams best represents the relationship between the following classes? [CGL 7/3/2020 Afternoon]
Accountants, Girls, Internet users
In the given Venn Diagram, the ‘rectangle’ represents ‘ladies of a club' , the ‘triangle’ represents ‘like to dance’, the ‘circle’ represents ‘like to sing’ and the ‘pentagon’ represents ‘like to mimic’. The number given in the diagram represents the number of persons in that particular category. [ CGL 7/3/2020 Evening]
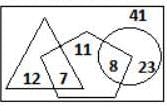
How many ladies of the club NEITHER like to dance NOR like to mimic?
IWhich o f the following Venn diagrams best represents the relationship between the classes? [CGL 9/3/2020 Morning]
Tables , Wooden objects ,Chairs.
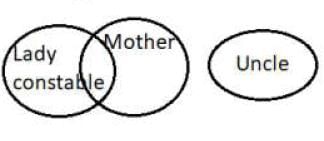
Which o f the following Venn diagrams best represents the relationship between the following classes? [CGL 9/3/2020 Afternoon]
Lady Constables , Uncles , Mothers
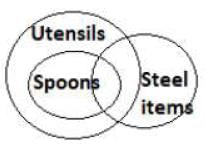
Which of the following Venn diagrams best represents the relationship between the following classes? [CGL 9/3/2020 Evening]
Utensils , Spoons , Steel items.


