Test: SSC CGL Previous Year Questions: Venn Diagram (2020-19) with solutions
MCQ Practice Test & Solutions: Test: SSC CGL Previous Year Questions: Venn Diagram (2020-19) (39 Questions)
You can prepare effectively for SSC CGL SSC CGL Previous Year Papers with this dedicated MCQ Practice Test (available with solutions) on the important topic of " Test: SSC CGL Previous Year Questions: Venn Diagram (2020-19)". These 39 questions have been designed by the experts with the latest curriculum of SSC CGL 2026, to help you master the concept.
Test Highlights:
- - Format: Multiple Choice Questions (MCQ)
- - Duration: 20 minutes
- - Number of Questions: 39
Sign up on EduRev for free to attempt this test and track your preparation progress.

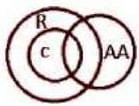
Select the Venn diagram that best illustrates the relationship between the following classes. [CGL 04/06/2019 afternoon]
Parents, Rich Persons, Farmers.
Parents, Rich Persons, Farmers.
Detailed Solution: Question 1

Select the Venn Diagram that best illustrates the relationship between the following classes. [CGL 04/06/2019 Evening]
Graduates , Literates and Hardworking.
Graduates , Literates and Hardworking.
Detailed Solution: Question 2


Select the Venn diagram that illustrates the relationship between the following classes.[CGL 06/06/2019 Morning]
Snakes, Reptiles, Poisonous.
Snakes, Reptiles, Poisonous.
Detailed Solution: Question 3

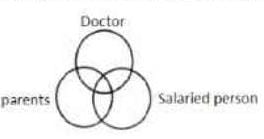
Select the Venn diagram that best illustrates the relationship between the following classes. [CGL 06/06/19 Afternoon]
Doctors/ Salaried Persons/ Parents.
Doctors/ Salaried Persons/ Parents.
Detailed Solution: Question 4
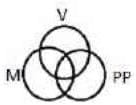
Choose the Venn diagram that best illustrates the relationship among the following classes. [CGL 06/06/2019 Evening]
Women , Entrepreneurs , Engineers.
Women , Entrepreneurs , Engineers.
Detailed Solution: Question 5

Choose the venn diagram that best illustrates the relationship among the following classes. [CGL 07/06/2019 Morning]
Crocodiles, Aquatic animals , Reptiles
Crocodiles, Aquatic animals , Reptiles
Detailed Solution: Question 6
Select the Venn diagram that best illustrates the relationship between the following classes. [CGL 07/06/2019 Afternoon]
Graduates , Teachers , Literates.
Graduates , Teachers , Literates.
Detailed Solution: Question 7

elect the venn diagram that best illustrates the relationship between the following classes. [CGL 07/06/2019 Evening]
Villagers , Poor Persons , Males.
Villagers , Poor Persons , Males.
Detailed Solution: Question 8
Select the venn diagram that best illustrates the relationship between the following classes. [CGL10/06/2019 Morning]
Indians , Females , Voters.
Indians , Females , Voters.
Detailed Solution: Question 9
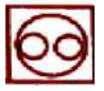
Which one of the following figures represents students, teachers and schools? [CGL 10/06/2019 Afternoon]
Detailed Solution: Question 10
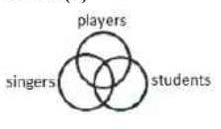
Which one of the following figures represents players, singers and students? [CGL 10/06/2019 Evening]
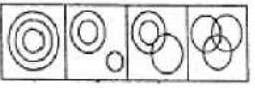
Detailed Solution: Question 11
Which one of the following figures represents wheat, mustard and cabbage? [CGL 11/06/2019 Morning]
Detailed Solution: Question 12
Which one of the following figures represents bowl, table and crockery? [CGL 11/06/2019 Afternoon]
Detailed Solution: Question 13

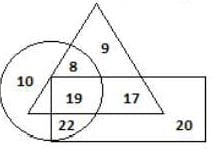
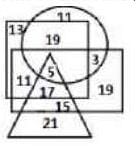
In the venn diagram given below, the ‘Circle’ represents ‘Ladies’ , the ‘triangle’ represents ‘Constables’ and the ‘square’ represents ‘Married Persons'. The numbers given in the diagram represents the number of persons of that particular category. [CGL 11/06/2019 Evening]
How many lady constables are not married?
How many lady constables are not married?
Detailed Solution: Question 14
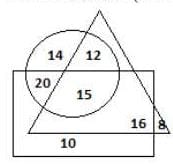
In the given venn diagram, the circle represents ‘businessman’, the triangle represents ‘landlords' and the rectangle represents ‘income tax payers’. The numbers given in the diagram represent the number of persons in that particular category. [CGL12/06/2019 Morning]
How many businessmen are taxpayers but NOT landlords?
How many businessmen are taxpayers but NOT landlords?
Detailed Solution: Question 15
In the given Venn diagram, the pentagon represents ‘cricketers', the square represents ‘Chess players’ and the circle represents ‘Clerks’. The numbers given in the diagram represent the number of persons in that particular category. [CGL 12/06/2019 Afternoon]
How many cricketers are chess players but NOT clerks?
How many cricketers are chess players but NOT clerks?
Detailed Solution: Question 16
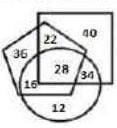
In the given Venn diagram, the hexagon represents 'farmers', the circle represents 'beneficiaries' and the square represents 'land-owners'. The numbers given in the diagram represent thenumber of persons in that particular category. [CGL 13/06/2019( Morning]
How many farmers are both land-owners and beneficiaries?
Detailed Solution: Question 17
Choose the Venn diagram which best illustrates the relationship among the three given classes. [CGL13/06/2019 Evening]
Fruit, Vegetable, Apple.
Fruit, Vegetable, Apple.
Detailed Solution: Question 18
The given Venn diagram represents employees in an organisation The triangle represents executives, the circle represents females, the rectangle represents MBAs and the square represents technical staff. The numbers given in the diagram represent the number of persons in that particular category. [CGL 3/3/2020 Morning]
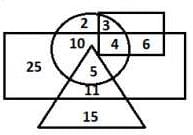
How many female executives are there in the organisation?
How many female executives are there in the organisation?
Detailed Solution: Question 19
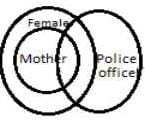
Which of the following Venn diagrams best represents the relationship between the following classes? [CGL 3/3/2020 Evening]
Police Officers, Mothers, Females
Police Officers, Mothers, Females
Detailed Solution: Question 20
Thc given Venn diagram represents artists in a circus: The triangle represents Clowns, the circle represents acrobats, the rectanglerepresents males and the square represents ringmasters. The numbers given in the diagram represent the number of persons in that particular category.
How many male clowns are also ringmasters, but NOT acrobats.
How many male clowns are also ringmasters, but NOT acrobats.
Detailed Solution: Question 21
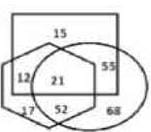
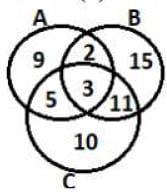
In the given Venn diagram ‘Group A’ represents those who can speak ‘English’, ‘Group B’ represents those who can speak ‘Hindi’, and ‘Group C’ represents those who can speak ‘Marathi’. The numbers given in the diagram represent the number of persons in that particular category. [CGL 4/3/2020 Afternoon]
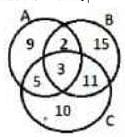
How many persons can speak exactly two languages?
How many persons can speak exactly two languages?
Detailed Solution: Question 22
In the given Venn diagram, the ‘rectangle’ represents ‘engineers’, the ‘circle’ represents ‘managers’, and the ‘triangle’ represents ‘married’. The numbers given the diagram represent the number of persons in that particular category. [CGL 4/3/2020 Evening]
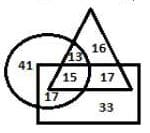
How many people arc married but NOT engineers?
Detailed Solution: Question 23
In the given Venn diagram, the triangle represents students playing table tennis , the rectangle represents students playing badminton, the circle represents female students, and the pentagon represents students playing football. The numbers given in the diagram represent the number of person in the particular category. [CGL 5/3/2020 Morning]
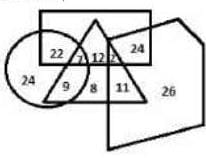
How many female students play both table tennis and badminton?
How many female students play both table tennis and badminton?
Detailed Solution: Question 24
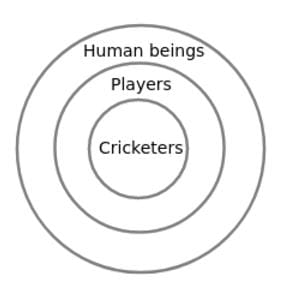
Which of thefollowing Venn diagrams best represents the relationship between the following classes? [CGL 5/3/2020 Evening]
Cricketers/Players/ Human beings.
Cricketers/Players/ Human beings.
Detailed Solution: Question 25
Which of the following sets is best represented by the given Venn diagram ? [CGL 6/3/2020 Afternoon]
Detailed Solution: Question 26
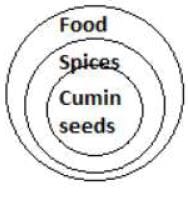
W hich o f th e fo llo w in g Venn diagrams best represents the relationship between the following classes? [CGL 6/3/2020 Evening]
Spices , Cumin seeds, Food
Spices , Cumin seeds, Food
Detailed Solution: Question 27
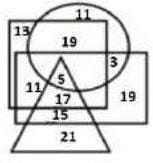
Thc given Venn diagram represents results of a class of students.[CGL 7/3/2020 Morning]
The triangle represents students who scored 85% and above in Maths, the circle represents students who scored 85% and above in English, the rectangle represents students who scored 85% and above in Science, and the square represents students who scored 85% and above in Social Sciences. The numbers given in the diagram represent the number of students in that particular category.
How many students scored 85% and above in all the subjects?
The triangle represents students who scored 85% and above in Maths, the circle represents students who scored 85% and above in English, the rectangle represents students who scored 85% and above in Science, and the square represents students who scored 85% and above in Social Sciences. The numbers given in the diagram represent the number of students in that particular category.
Detailed Solution: Question 28
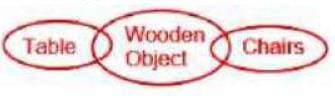
IWhich o f the following Venn diagrams best represents the relationship between the classes? [CGL 9/3/2020 Morning]
Tables , Wooden objects ,Chairs.
Tables , Wooden objects ,Chairs.
Detailed Solution: Question 29
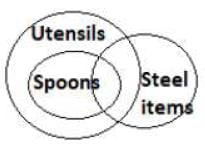
Which of the following Venn diagrams best represents the relationship between the following classes? [CGL 9/3/2020 Evening]
Utensils , Spoons , Steel items.
Utensils , Spoons , Steel items.
Detailed Solution: Question 30
313 docs|325 tests |