Test: Gaseous State - 2 - Chemistry MCQ
30 Questions MCQ Test - Test: Gaseous State - 2
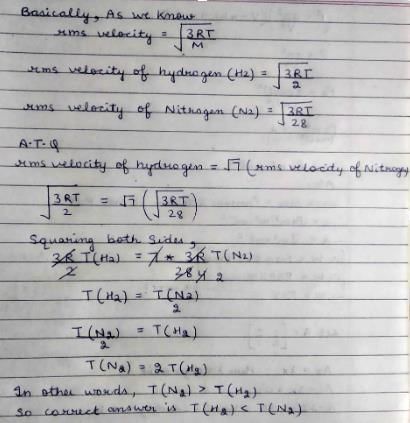
The rms velocity of hydrogen is  times the rms velocity of nitrogen. It T is the temperature of the gas:
| 1 Crore+ students have signed up on EduRev. Have you? Download the App |
The compressibility of a gas is less than unity at STP. Therefore,
At 100°C and 1 at m if the density of the liquid water is 1.0 g cm–3 and that of water vapour is 0.0006 g cm–3, then the volume occupied by water molecules in 1 L of steam at this temperature is:
The root mean square velocity of an ideal gas at constant pressure varies with density (d) as
Which of the following volume (V) temperature (T) plots presents the behaviour of one mole of an ideal gas at the atmospheric pressure?
Positive deviation from ideal behaviour takes place because of:
For a monatomic gas kinetic energy = E. The relation with rms velocity is:
If helium and methane are allowed to diffuse out of the container under the similar conditions of temperature and pressure, then the ratio of rate of diffusion of helium to methane is:
The term that corrects for the attractive forces present in a real gas in the van der Waals’ equation is:
The intermolecular interaction that is dependent on the inverse cube of distance between the molecule is:
One mole of a monoatomic real gas sat isfied the equation p(V – b) = RT where b is a constant. The relationship of interatomic potential V ( r) and interatomic distance r for the gas is given by:
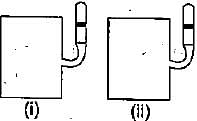
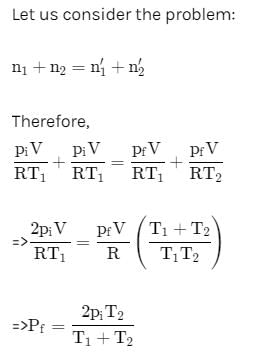
Two closed bulbs of equal volume (V) containing an ideal gas initially at pressure pi and temperature T1 are connected through a narrow tube of negligible volume as shown in the figure below. The temperature of one of the bulb is then raised to T2. The final pressure pf is:
For one mole of a van der Waals’ gas when b = 0 and T = 300 K, the PV vs. 1/V plot is shown below. The value of the van der Waals’ constant a (atm. litre2 mo l–2) is:
If Z is a compressibility factor, van der Waals’ equation at low pressure can be written as:
A kid has been playing with an inflated balloon. Suddenly, a reaction happens inside the balloon. This causes the inside surface of the balloon to become sticky, so that some of the air molecules inside which collide against the surface get stuck to it. As a result, immediately after the reaction, the balloon will:
The non-bonded interactions between two molecules consist of electrostatic (El) and van der Waals’ (vdW) forces. Which of the following is a correct description of the distance dependence intermolecular interactions between two molecules?
The state of a certain amount of a gas, not necessarily ideal, is changed from A to B in various hypothetical paths, as shown below. The total amount of the gas remains constant. Which of the following paths are physically realizable:
Real gases behave differently from ideal gases because:
(I) The molecules of real gases are in constant motion.
(II) Molecules of real gases collide with the walls of the containers.
(III) Molecules of real gases have vo lume
(IV) Molecules of real gases attract each other.
The relationship between the van der Waals’ b coefficient of N2 and O2 is:
From the kinetic theory of gases, the ratio of most probable speed (Cmp) to root mean square speed (Crms) is:
According to the equipartition principle of energy, the molar heat capacity at constant volume for CO2(g), SO2(g) and H2O(g) follows the trends:
The average speed H2, N2 and O2 gas molecules is in the order:
Based on the principle of equipartition of energy, the mo lar heat capacity of CO2 at constant volume Cv,m is:
The molar internal energy of a gas at temperature T is Um (T). The mo lar internal energy at T = 0 is Um (0). The correct expression that relates these two with appropriate contributions is:
Consider, the two identical containers, one with 1 mole of H2 and the other with 1 mole of He. If the root mean square (RMS) velocities of the two gases are the same, then the ratio of the temperature, is:

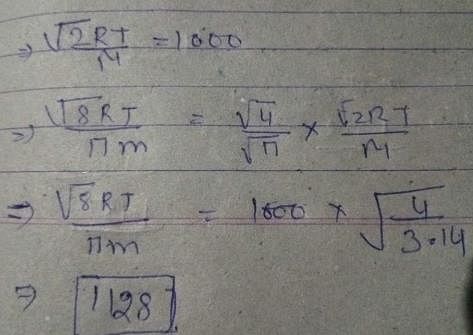
Given that the most probable speed of oxygen gas is 1000 ms–1, the mean/average speed (ms–1) under the same conditions is:
The Maxwell-Boltzmann distribution for molecular speeds is shown in the following figure
In the figure, H is the height of the peak, L is the location of the maximum and W is the width at half height. As the temperature is decreased:


