Venn Diagram - 2 - Free MCQ Practice Test with solutions, SSC CGL GI
MCQ Practice Test & Solutions: 12 Min Test: Venn Diagram - 2 (15 Questions)
You can prepare effectively for SSC CGL General Intelligence and Reasoning for SSC CGL with this dedicated MCQ Practice Test (available with solutions) on the important topic of "12 Min Test: Venn Diagram - 2". These 15 questions have been designed by the experts with the latest curriculum of SSC CGL 2026, to help you master the concept.
Test Highlights:
- - Format: Multiple Choice Questions (MCQ)
- - Duration: 12 minutes
- - Number of Questions: 15
Sign up on EduRev for free to attempt this test and track your preparation progress.

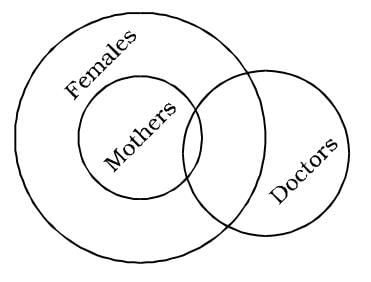
Which diagram represents the relationship among female, mothers and doctors?
Detailed Solution: Question 1
Which one of the following figures represents relationship among furniture, chairs, tables?
Detailed Solution: Question 2


In a group of 40 players, some play cricket, some play foot-ball and some both. If 30 play cricket and 20 both, the correct way of representing above by Venn Diagram is
Detailed Solution: Question 3

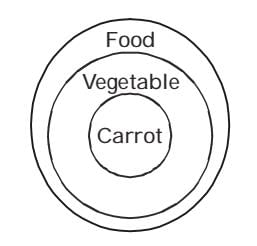
Which of the following Venn diagrams correctly illustrates the relationship among the classes Carrot, Food, Vegetables?
Detailed Solution: Question 4
Detailed Solution: Question 5
Which diagram correctly represents the relationship between politicians, poets and women?
Detailed Solution: Question 6

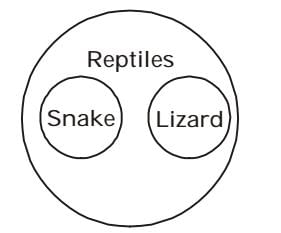
Which one of the following Venn diagrams represents the best relationship between Snake, Lizard, Reptiles?
Detailed Solution: Question 7
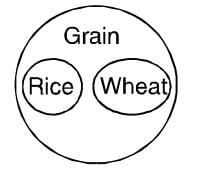
Which one of the following represents Rice, Wheat and Grain?
Detailed Solution: Question 8
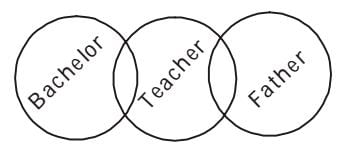
Which one of the following diagrams represents bachelors, teachers and fathers?
Detailed Solution: Question 9
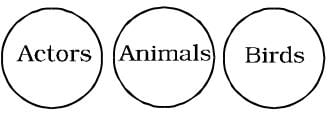
Which of the following figures represents actors, animals, birds?
Detailed Solution: Question 10
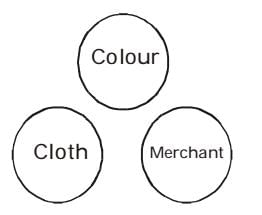
Which of the following diagrams represents Colour , Cloth and Merchant?
Detailed Solution: Question 11
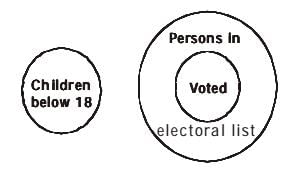
Select from the given diagram the one that illustrates the relationship among the given 3 classes:
children below 18, persons in the electoral list, those who have voted.
children below 18, persons in the electoral list, those who have voted.
Detailed Solution: Question 12
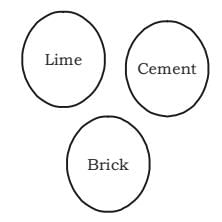
Which one of the following represents Lime, Cement and Brick?
Detailed Solution: Question 13
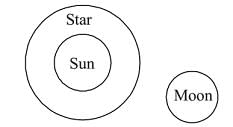
Which of the following diagrams represents the relationship among Sun, Moon and Star?
Detailed Solution: Question 14
In the following figure, how many educated people are employed?
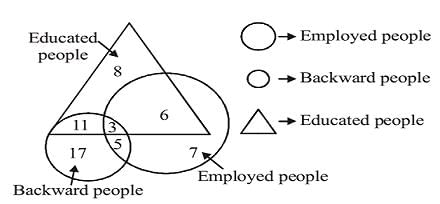
Detailed Solution: Question 15
177 videos|264 docs|169 tests |
177 videos|264 docs|169 tests |