


All Exams > Electrical Engineering (EE) > 6 Months Preparation for GATE Electrical > All Questions
All questions of Oscilloscopes for Electrical Engineering (EE) Exam
A CRO can display:- a)D.C. signals only
- b)A.C. signals only
- c)Both D.C. and A.C. signals
- d)Time-invariant signals
Correct answer is option 'C'. Can you explain this answer?
A CRO can display:
a)
D.C. signals only
b)
A.C. signals only
c)
Both D.C. and A.C. signals
d)
Time-invariant signals
| | Ishani Iyer answered |
Understanding CRO Functionality
A Cathode Ray Oscilloscope (CRO) is a versatile electronic measurement instrument used to visualize electrical signals. The ability of a CRO to display different types of signals is crucial for various applications in electrical engineering.
Types of Signals Displayed by CRO
- D.C. Signals:
- Direct Current (D.C.) signals are characterized by a constant voltage level over time.
- A CRO can effectively display these signals as a straight horizontal line across the screen, representing the steady voltage level.
- A.C. Signals:
- Alternating Current (A.C.) signals vary periodically with time.
- The CRO displays A.C. signals as waveforms, such as sine, square, or triangular waves, illustrating the fluctuations in voltage over time.
Why Both D.C. and A.C.?
- Versatility:
- The ability to display both D.C. and A.C. signals makes the CRO a powerful tool for engineers and technicians. It provides a comprehensive view of the electrical behavior of circuits.
- Measurement Capabilities:
- By analyzing both types of signals, users can troubleshoot circuits, measure signal amplitude, frequency, and phase relationships, and ensure that devices operate within desired parameters.
- Waveform Analysis:
- The CRO enables users to observe the shape of signals, which is crucial for understanding circuit performance and diagnosing issues.
Conclusion
In summary, a CRO can display both D.C. and A.C. signals, making option 'C' the correct answer. This capability is essential for effective electrical testing and analysis in various engineering applications.


An oscilloscope works similar to _______.- a)an ohmmeter
- b)a voltmeter
- c)an ammeter
- d)a multimeter
Correct answer is option 'B'. Can you explain this answer?
An oscilloscope works similar to _______.
a)
an ohmmeter
b)
a voltmeter
c)
an ammeter
d)
a multimeter
| | Pooja Patel answered |
Oscilloscope is a visual voltmeter with a timer that shows when a voltage changes.
Oscilloscope is defined as an electronic instrument that is used to measure and analyze electronic signals ( waves and pulses) displayed on its screen.
It's functions are:
Oscilloscope is defined as an electronic instrument that is used to measure and analyze electronic signals ( waves and pulses) displayed on its screen.
It's functions are:
- Shows and calculate the frequency and amplitude of an oscillating signal.
- Shows the voltage and time of a particular signal.
- Shows the content of the AC voltage or DC voltage of the signal.
Which of the following is used to analyze all kinds of matters?- a)Spectrophotometers
- b)Electron Microscope
- c)X-ray diffractometer
- d)Spectrum analyzer
Correct answer is option 'C'. Can you explain this answer?
Which of the following is used to analyze all kinds of matters?
a)
Spectrophotometers
b)
Electron Microscope
c)
X-ray diffractometer
d)
Spectrum analyzer
| | Pooja Patel answered |
Concept:
X-ray Diffractometer:
X-ray Diffractometer:
- Most useful in the characterization of crystalline materials.
- Ex- Metals, inter-metallic, ceramics, minerals, polymers, and plastics.
- Used to identify phases, grain size, texture, and crystal imperfections.
- Rapid and non- destructive to analyze all kinds of matter ranging from fluids to powders and crystals.
- Lattice parameters and lattice type determinations.
Spectrophotometer:
- A spectrophotometer is an analytical instrument used to quantitatively measure the transmission or reflection of visible light, UV light or infrared light.
- Spectrophotometers measure intensity as a function of light source wavelength.
- There is an interaction between electromagnetic radiation (light) and matter in the spectrophotometer.
- Its applications include measurement of substance concentration such as protein, DNA or RNA, growth of bacterial cells, and enzymatic reactions.
Electron Microscope:
- Uses electron beams instead of light.
- Because of a much lower wavelength of the electron beam than that of light, the resolution is far much better.
- Used to examine cells, microorganisms, metals, crystals
Spectrum Analyzer:
- A measuring instrument that displays an electrical signal according to its frequency.
- Each frequency component contained in the input signal is displayed as a signal level corresponding to that frequency.
What is the frequency of the sinusoidal signal that occupies five horizontal divisions and three vertical divisions on a CRO for one complete cycle, if the time base is set at 1 ms per division?- a)100 Hz
- b)250 Hz
- c)1 KHz
- d)200 Hz
Correct answer is option 'D'. Can you explain this answer?
What is the frequency of the sinusoidal signal that occupies five horizontal divisions and three vertical divisions on a CRO for one complete cycle, if the time base is set at 1 ms per division?
a)
100 Hz
b)
250 Hz
c)
1 KHz
d)
200 Hz
 | Pioneer Academy answered |
The given time base is set at 1 ms per division.
Also, for one complete cycle, the given sinusoidal signal occupies five horizontal divisions. This is as shown:
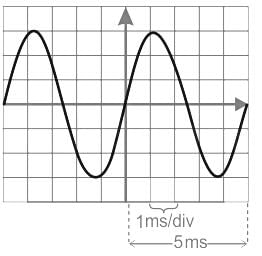
The time period of the sinusoid will be:
T = 5 × 1 ms = 5 ms
With
f = 1/T, the frequency of the sinusoid will be:

f = 200 Hz
Also, for one complete cycle, the given sinusoidal signal occupies five horizontal divisions. This is as shown:
The time period of the sinusoid will be:
T = 5 × 1 ms = 5 ms
With
f = 1/T, the frequency of the sinusoid will be:
f = 200 Hz
Lissajous pattern obtained on CRO is used to determine- a)Amplitude of applied signal
- b)Current in a circuit
- c)Distortion in a system
- d)Phase shift and frequency
Correct answer is option 'D'. Can you explain this answer?
Lissajous pattern obtained on CRO is used to determine
a)
Amplitude of applied signal
b)
Current in a circuit
c)
Distortion in a system
d)
Phase shift and frequency
| | Nitya Chopra answered |
Lissajous patterns obtained on a Cathode Ray Oscilloscope (CRO) are used to determine the phase shift and frequency of the applied signal.
Lissajous patterns are formed when two periodic signals, typically with different frequencies, are applied to the X and Y inputs of a CRO. These signals can be sinusoidal, square waves, or any other periodic waveforms. The resulting pattern on the CRO screen depends on the phase relationship between the two signals.
Here is how Lissajous patterns can be used to determine the phase shift and frequency of the applied signal:
1. Phase Shift:
- When the two signals have the same frequency and are in phase, a straight line is formed on the CRO screen, either vertically, horizontally, or diagonally.
- If there is a phase shift between the two signals, the resulting pattern will be an ellipse.
- The orientation and shape of the ellipse provide information about the phase shift. For example, if the ellipse is tilted to the right, it indicates a positive phase shift, while a tilt to the left indicates a negative phase shift.
- By analyzing the Lissajous pattern, the phase shift between the two signals can be determined accurately.
2. Frequency:
- The Lissajous pattern also provides information about the frequency of the applied signal.
- The number of lobes in the pattern indicates the ratio of the frequencies of the two signals.
- For example, if the pattern has two lobes, it means that the frequency of the Y signal is twice that of the X signal.
- By counting the number of lobes, the frequency ratio and hence the frequency of the applied signal can be determined.
It is important to note that Lissajous patterns are accurate only when the frequencies of the two signals are known and stable. Additionally, the amplitude and distortion of the signals do not affect the formation of the Lissajous pattern.
In conclusion, Lissajous patterns obtained on a CRO are useful for determining the phase shift and frequency of an applied signal. These patterns provide visual representations that help in accurately analyzing and measuring the phase relationship between two signals.
For the recording of very fast random signals, the most suitable instrument would be- a)dual-trace
- b)sampling oscilloscope
- c)real-time spectrum analyzer
- d)scanning-type spectrum analyzer
Correct answer is option 'C'. Can you explain this answer?
For the recording of very fast random signals, the most suitable instrument would be
a)
dual-trace
b)
sampling oscilloscope
c)
real-time spectrum analyzer
d)
scanning-type spectrum analyzer
| | Prerna Tiwari answered |
Introduction:
When recording very fast random signals, it is important to use the most suitable instrument that can accurately capture and analyze the signal. Different instruments have different capabilities, and the choice depends on the specific requirements and characteristics of the signals being recorded. In this case, the most suitable instrument would be a real-time spectrum analyzer.
Explanation:
1. Dual-trace:
A dual-trace oscilloscope is commonly used for displaying two signals simultaneously, which can be useful for comparing and analyzing two different signals. However, it may not be the best choice for recording very fast random signals, as it may not have the sufficient bandwidth or sampling rate to accurately capture and analyze the signals in real-time.
2. Sampling oscilloscope:
A sampling oscilloscope is designed to capture and display repetitive signals by taking samples at a high rate and reconstructing the waveform. While it can be useful for certain applications, it may not be suitable for recording very fast random signals, as it may not have the necessary bandwidth or real-time analysis capabilities to handle the random nature of the signals.
3. Scanning-type spectrum analyzer:
A scanning-type spectrum analyzer is used to measure the power spectrum of a signal by scanning through a range of frequencies. It is commonly used for analyzing signals with frequency components that are relatively stable and predictable. However, it may not be ideal for recording very fast random signals, as it may not have the capability to capture and analyze the signals in real-time.
4. Real-time spectrum analyzer:
A real-time spectrum analyzer is specifically designed to capture and analyze signals in real-time. It can provide a detailed frequency analysis of signals with varying frequencies and amplitudes. It is capable of capturing and displaying very fast random signals accurately and in real-time, making it the most suitable instrument for this application.
Conclusion:
In conclusion, when recording very fast random signals, the most suitable instrument would be a real-time spectrum analyzer. It has the necessary bandwidth, sampling rate, and real-time analysis capabilities to accurately capture and analyze the signals, providing a detailed frequency analysis of the random signals.
Which of the following is used to measure the transmission or reflection of visible light, UV light or infrared light ?- a)Spectrophotometers
- b)Electron Microscope
- c)X-ray diffractometer
- d)Spectrum analyzer
Correct answer is option 'A'. Can you explain this answer?
Which of the following is used to measure the transmission or reflection of visible light, UV light or infrared light ?
a)
Spectrophotometers
b)
Electron Microscope
c)
X-ray diffractometer
d)
Spectrum analyzer
| | Pooja Patel answered |
Spectrophotometer:
- A spectrophotometer is an analytical instrument used to quantitatively measure the transmission or reflection of visible light, UV light, or infrared light.
- Spectrophotometers measure intensity as a function of light source wavelength.
- There is an interaction between electromagnetic radiation (light) and matter in the spectrophotometer.
- Its applications include measurement of substance concentration such as protein, DNA or RNA, growth of bacterial cells, and enzymatic reactions. Hence option (1) is the correct answer.
With _______ testing it is possible to see even smallest distortions clearly on CRO.- a)square wave
- b)triangular wave
- c)sine wave
- d)sawtooth wave
Correct answer is option 'A'. Can you explain this answer?
With _______ testing it is possible to see even smallest distortions clearly on CRO.
a)
square wave
b)
triangular wave
c)
sine wave
d)
sawtooth wave
| | Pooja Patel answered |
Analysis:
Square Wave:
Square Wave:
- A common wave shape consisting of repeating square pulses.
- A square wave is a voltage that turns on and off (or goes high and low) at regular intervals.
- It is a standard wave for testing an amplifiers increase the amplitude of a square wave with minimum distortion.
- Television, radio and computer circuitry often use square waves for timing signals.
Most oscilloscopes have a square wave reference signal available at a terminal on the front panel used to compensate the probe. Some precautions are -
- Attach the probe to a vertical channel.
- Connect the probe tip to the probe compensation.
- Attach the ground clip of the probe to ground.
- View the square wave reference signal.
- Make the proper adjustments on the probe so that the corners of the square wave are square.
Square wave testing it is possible to see even smallest distortions clearly on CRO.
When a PLL is being used as a frequency synthesizer, the output is taken from - a)the LPF output
- b)the VCO output
- c)phase comparator output
- d)the output of error amplifier
Correct answer is option 'B'. Can you explain this answer?
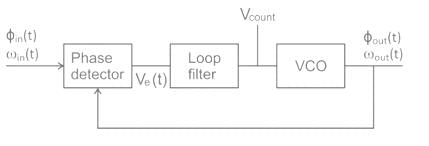
When a PLL is being used as a frequency synthesizer, the output is taken from
a)
the LPF output
b)
the VCO output
c)
phase comparator output
d)
the output of error amplifier
| | Pooja Patel answered |
When a PLL is being used as a frequency synthesizer, the output is taken from the VCO output
A PLL is a feedback system that includes a VCO, phase detector, and low pass filter within its loop.
Its purpose is to force the VCO to replicate and track the frequency and phase at the input when in lock.
The PLL is a control system allowing one oscillator to track with another.
It is possible to have a phase offset between input and output, but when locked, the frequencies must exactly track.
Applications
- Clock generation
- Frequency synthesizer
- Clock recovery in a serial data link
Chapter doubts & questions for Oscilloscopes - 6 Months Preparation for GATE Electrical 2026 is part of Electrical Engineering (EE) exam preparation. The chapters have been prepared according to the Electrical Engineering (EE) exam syllabus. The Chapter doubts & questions, notes, tests & MCQs are made for Electrical Engineering (EE) 2026 Exam. Find important definitions, questions, notes, meanings, examples, exercises, MCQs and online tests here.
Chapter doubts & questions of Oscilloscopes - 6 Months Preparation for GATE Electrical in English & Hindi are available as part of Electrical Engineering (EE) exam. Download more important topics, notes, lectures and mock test series for Electrical Engineering (EE) Exam by signing up for free.
6 Months Preparation for GATE Electrical675 videos|1390 docs|885 tests |