


All Exams > OPSC OCS (Odisha) > 6 Months Preparation Course for OPSC > All Questions
All questions of Pie Charts for OPSC OCS (Odisha) Exam
If the total investment from FII's is 33% and is doubled next year, what will their new percentage be?- a)40%.
- b)50%.
- c)66%.
- d)70%.
Correct answer is option 'C'. Can you explain this answer?
If the total investment from FII's is 33% and is doubled next year, what will their new percentage be?
a)
40%.
b)
50%.
c)
66%.
d)
70%.
| | Jay Sen answered |
Understanding the Initial Investment
The initial investment from Foreign Institutional Investors (FIIs) is 33%. This percentage represents the portion of total investments made by FIIs in a given market or asset.
Doubling the Investment
If the investment from FIIs doubles next year, we need to calculate the new total investment.
- Current FII investment: 33%
- If this amount doubles, the new investment will be 33% x 2 = 66%.
Calculating the New Percentage
To determine the new percentage of FII investment in relation to the total investment:
1. Assume the total investment is 100 units.
2. Current FII investment: 33 units.
3. New FII investment after doubling: 66 units.
4. Total investment remains the same at 100 units.
Now, the new percentage of FII investment can be calculated as:
- New FII investment percentage = (New FII investment / Total investment) x 100
- New FII investment percentage = (66 / 100) x 100 = 66%.
Conclusion
Thus, after doubling their investment, FIIs will make up 66% of the total investment, making the correct answer option 'C'.

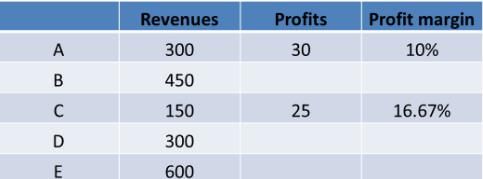
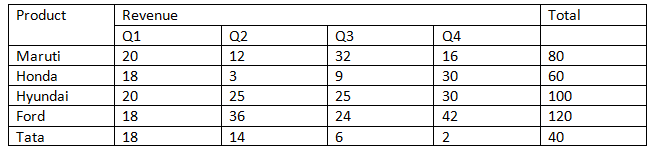
Total revenues are Rs. 1800 crores. Overall profit margin is 10%. The division with the largest revenue has the least profit margin but not the least profits. The division with the profit margin higher than all others generates the least profit. Exactly one division has the same profit margin as the overall Company. Company D generates more profits than Company E.
 Q. How much profit did Company A make?
- a)Rs. 60 crores
- b)Rs. 50 crores
- c)Rs. 25 crores
- d)Rs. 30 crores
Correct answer is option 'D'. Can you explain this answer?
Total revenues are Rs. 1800 crores. Overall profit margin is 10%. The division with the largest revenue has the least profit margin but not the least profits. The division with the profit margin higher than all others generates the least profit. Exactly one division has the same profit margin as the overall Company. Company D generates more profits than Company E.
Q. How much profit did Company A make?
a)
Rs. 60 crores
b)
Rs. 50 crores
c)
Rs. 25 crores
d)
Rs. 30 crores
 | Impact Learning answered |
- Total revenues are Rs. 1800 crores.
- Overall profit margin is 10%
- Overall profit is Rs. 180 crores.
- Exactly one division has the same profit margin as the overall Company. So, for this division, share of revenues should be equal to share of profits. Or, one of Company A or D has a profit margin of 10%
- Let us also compute absolute profit numbers the 5 numbers are Rs. 35 crores, Rs. 40 crores, Rs. 25 crores, Rs. 30 crores and Rs. 50 crores
- The division with the largest revenue has the least profit margin but not the least profits: So, E has the least profit margin but not the least profits. Company D generates more profits than Company E, so Company E does not generate the least profit either
- So, Company E should generate profits of Rs. 35 crores or Rs. 40 crores.
- Now, this is the critical statement - "The division with the profit margin higher than all others generates the least profit? Company C has the least revenue, and by a distance. So, it is possible that division C should have the highest profit margin. The lowest profit margin for division C should be 16.67%, Now, if the Rs. 25 crore profit were for any other division, the profit margin of that division would be less than 16.67%. This tells us that the Rs. 25 crore profit is made by division C at a profit margin of 16.67%.
- So this is where we stand now
- The three missing profit numbers are Rs. 50 crores, Rs. 40 crores and Rs. 35 crores
- Company E did not generate profit of Rs. 50 crores. So, the Rs. 50 crore profit number should have been seen by either B or D. If it had been D, then D would also have had a profit margin of 16,67%. But this is not possible as the question says - "The division with the profit margin higher than all others generates the least profit. The above statement tells us that no company apart from C had a profit margin of 16.67% or more. So, Company B should have seen a profit of Rs. 50 crores.
- Company D generates more profit than E so E should have seen a profit of 35 crores and D a profit of Rs 40 crores
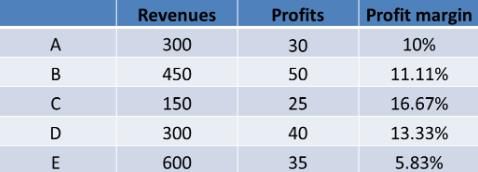
- Therefore, the Profit that Company A made is equal to 30 crores
The following pie-chart shows the percentage distribution of the expenditure incurred in publishing a book. Study the pie-chart and the answer the questions based on it.Various Expenditures (in percentage) Incurred in Publishing a Book
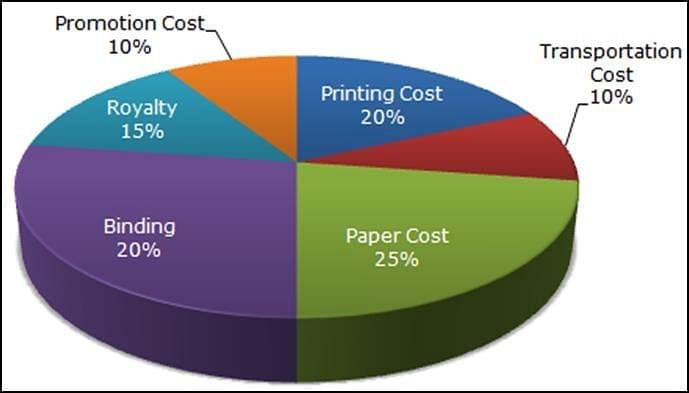 Q. If for a certain quantity of books, the publisher has to pay Rs. 30,600 as printing cost, then what will be amount of royalty to be paid for these books?
- a)Rs. 22,950
- b)Rs. 21,200
- c)Rs. 19,450
- d)Rs. 26,150
Correct answer is option 'A'. Can you explain this answer?
The following pie-chart shows the percentage distribution of the expenditure incurred in publishing a book. Study the pie-chart and the answer the questions based on it.
Various Expenditures (in percentage) Incurred in Publishing a Book
Q. If for a certain quantity of books, the publisher has to pay Rs. 30,600 as printing cost, then what will be amount of royalty to be paid for these books?
a)
Rs. 22,950
b)
Rs. 21,200
c)
Rs. 19,450
d)
Rs. 26,150
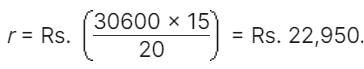
 | Upsc Rank Holders answered |
Let the amount of Royalty to be paid for these books be Rs. r.
Then, 20 : 15 = 30600 : r
What is the percentage of total investment from NRI’s if their investment is worth INR 4,000 crore and represents 11% of the total?- a)40%
- b)11%
- c)33%
- d)44%
Correct answer is option 'B'. Can you explain this answer?
What is the percentage of total investment from NRI’s if their investment is worth INR 4,000 crore and represents 11% of the total?
a)
40%
b)
11%
c)
33%
d)
44%
 | T.S Academy answered |
The percentage of total investment from NRI’s is 11% as stated in the problem.
This means that the investment of INR 4,000 crore is directly representing 11% of the total value.
This means that the investment of INR 4,000 crore is directly representing 11% of the total value.
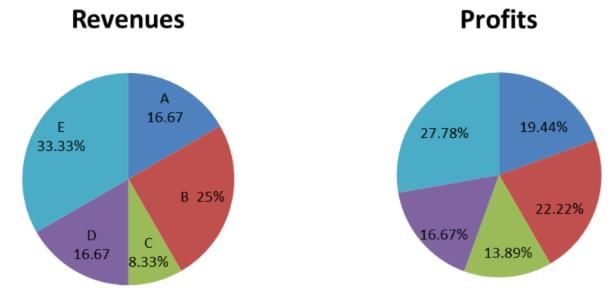
Instructions: The pie chart shown below gives the percentage distribution of car sales (in
numbers) between five companies – Maruti, Honda, Hyundai, Ford and Tata during the year 2014 – 2015. The total number of cars sold by the five companies together in 2014-2015 is four hundred thousand.
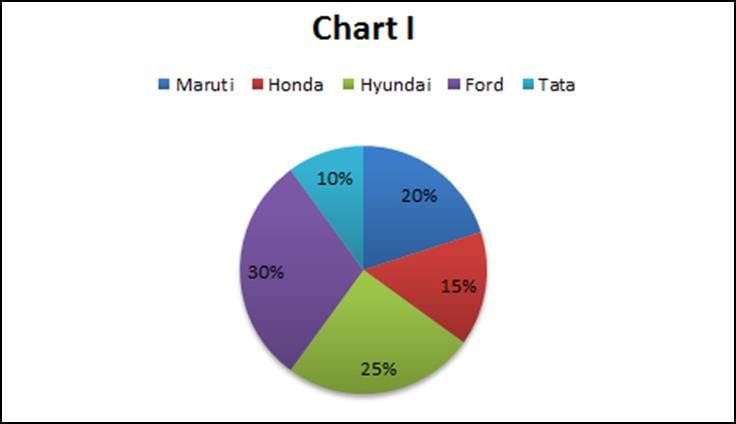
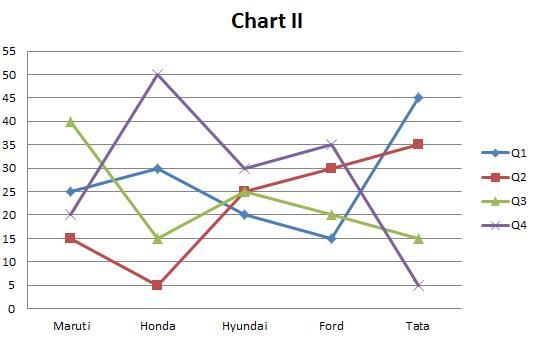
The line graph shown below gives the percentage distribution of the number of cars sold by each of the five companies in the four different Quarters of the year.
 Q. Which company sold the highest number of cars in the second quarter?
- a)Ford
- b)Maruti
- c)Honda
- d)Hyundai
Correct answer is option 'A'. Can you explain this answer?
Instructions: The pie chart shown below gives the percentage distribution of car sales (in
numbers) between five companies – Maruti, Honda, Hyundai, Ford and Tata during the year 2014 – 2015. The total number of cars sold by the five companies together in 2014-2015 is four hundred thousand.
The line graph shown below gives the percentage distribution of the number of cars sold by each of the five companies in the four different Quarters of the year.
Q. Which company sold the highest number of cars in the second quarter?
a)
Ford
b)
Maruti
c)
Honda
d)
Hyundai
 | Aspire Academy answered |
The data given in the pie chart and the line chart can be tabulated into the following table (Data is in 000’s):
From the table, we can see that Ford sold the highest number of cars in the second quarter.
From the table, we can see that Ford sold the highest number of cars in the second quarter.
Total revenues are Rs. 1800 crores. Overall profit margin is 10%. The division with the largest revenue has the least profit margin but not the least profits. The division with the profit margin higher than all others generates the least profit. Exactly one division has the same profit margin as the overall Company. Company D generates more profits than Company E.
 Q. What was the profit margin for company B?
- a)8.33%
- b)12.5%
- c)11.11%
- d)12.33%
Correct answer is option 'C'. Can you explain this answer?
Total revenues are Rs. 1800 crores. Overall profit margin is 10%. The division with the largest revenue has the least profit margin but not the least profits. The division with the profit margin higher than all others generates the least profit. Exactly one division has the same profit margin as the overall Company. Company D generates more profits than Company E.
Q. What was the profit margin for company B?
a)
8.33%
b)
12.5%
c)
11.11%
d)
12.33%
 | Elite Coaching Classes answered |
- Identify the emissions data:
• 2005: 500 million metric tons
• 2009: 800 million metric tons
• Total growth: 800 – 500 = 300 (60% increase over 4 years). - Calculate year‑on‑year growth rates:
• 2005–2006: (600 – 500) / 500 ≈ 20%
• 2006–2007: (650 – 600) / 600 ≈ 8.33%
• 2007–2008: (700 – 650) / 650 ≈ 7.69%
• 2008–2009: (800 – 700) / 700 ≈ 14.29% - Compute the arithmetic mean of annual growth rates:
(20% + 8.33% + 7.69% + 14.29%) / 4 ≈ 50.31% / 4 ≈ 12.5775%
Rounded to two decimal places: 12.57%.
Instructions:
For the following three questions: Answer the questions based on the pie charts given below. Chart 1 shows the distribution of 12 million tonnes of crude oil transported through different modes over a specific period of time. Chart 2 shows the distribution of the cost of transporting this crude oil. The total cost was Rs. 30 million.
 Q. If the costs per tonne of transport by ship, air and road are represented by P, Q and R respectively, which of the following is true?
- a)R > Q > P
- b)P > Q > R
- c)P > R > Q
- d)R > P > Q
Correct answer is option 'B'. Can you explain this answer?
Instructions:
For the following three questions: Answer the questions based on the pie charts given below. Chart 1 shows the distribution of 12 million tonnes of crude oil transported through different modes over a specific period of time. Chart 2 shows the distribution of the cost of transporting this crude oil. The total cost was Rs. 30 million.
Q. If the costs per tonne of transport by ship, air and road are represented by P, Q and R respectively, which of the following is true?
a)
R > Q > P
b)
P > Q > R
c)
P > R > Q
d)
R > P > Q
 | Riverdale Learning Institute answered |
If the costs per tonne of transport by ship, air and road are represented by P, Q and R respectively.
P = 10/9
Q = 7/11
R = 6/22
Q = 7/11
R = 6/22
We can see that P>Q and Q>R and P>R.
Instructions:
For the following three questions: Answer the questions based on the pie charts given below. Chart 1 shows the distribution of 12 million tonnes of crude oil transported through different modes over a specific period of time. Chart 2 shows the distribution of the cost of transporting this crude oil. The total cost was Rs. 30 million.
 Q. The cost in rupees per tonne of oil moved by rail and road happens to be roughly
- a)Rs. 3
- b)Rs. 1.5
- c)Rs. 4.5
- d)Rs. 8
Correct answer is option 'B'. Can you explain this answer?
Instructions:
For the following three questions: Answer the questions based on the pie charts given below. Chart 1 shows the distribution of 12 million tonnes of crude oil transported through different modes over a specific period of time. Chart 2 shows the distribution of the cost of transporting this crude oil. The total cost was Rs. 30 million.
Q. The cost in rupees per tonne of oil moved by rail and road happens to be roughly
a)
Rs. 3
b)
Rs. 1.5
c)
Rs. 4.5
d)
Rs. 8
 | S.S Career Academy answered |
Total tonnes of transportation by both rail and road is about 31*12/100 = 3.72 million tonnes and total cost incured 18*30/100 = 5.4 .
Hence required value is 5.4/3.72 which is about 1.5.
Hence option B .
What is the approximate ratio of NRI investments to corporate house investments if NRI’s account for 11% and corporate houses for 34%?- a)1:4.
- b)1:3.
- c)3:1.
- d)Cannot be determined.
Correct answer is option 'B'. Can you explain this answer?
What is the approximate ratio of NRI investments to corporate house investments if NRI’s account for 11% and corporate houses for 34%?
a)
1:4.
b)
1:3.
c)
3:1.
d)
Cannot be determined.
 | Lohit Matani answered |
The approximate ratio of NRI investments to corporate house investments is 11:34.
When simplified, this ratio is approximately 1:3.
When simplified, this ratio is approximately 1:3.
How many degrees does a complete pie chart represent?- a)180 degrees.
- b)360 degrees.
- c)90 degrees.
- d)270 degrees.
Correct answer is option 'B'. Can you explain this answer?
How many degrees does a complete pie chart represent?
a)
180 degrees.
b)
360 degrees.
c)
90 degrees.
d)
270 degrees.
 | K.L Institute answered |
A complete pie chart represents 360 degrees.
This total corresponds to 100 percent of the value of the continuous variable being represented.
This total corresponds to 100 percent of the value of the continuous variable being represented.
What is the primary function of a pie chart in data representation?- a)To show the relationship between two variables.
- b)To display data in a circular format, highlighting parts of a whole.
- c)To represent data trends over time.
- d)To compare multiple datasets side by side.
Correct answer is option 'B'. Can you explain this answer?
What is the primary function of a pie chart in data representation?
a)
To show the relationship between two variables.
b)
To display data in a circular format, highlighting parts of a whole.
c)
To represent data trends over time.
d)
To compare multiple datasets side by side.
 | Master Training Institute answered |
A pie chart is primarily used to display data in a circular format, highlighting the parts of a whole.
Each slice of the pie represents a category's proportion relative to the total, making it an effective tool for visualizing percentage relationships.
Each slice of the pie represents a category's proportion relative to the total, making it an effective tool for visualizing percentage relationships.
Which of the following is typically a limitation of pie charts?- a)They can represent multiple continuous variables.
- b)They are difficult to interpret with too many categories.
- c)They do not show percentage data.
- d)They can only display ordinal data.
Correct answer is option 'B'. Can you explain this answer?
Which of the following is typically a limitation of pie charts?
a)
They can represent multiple continuous variables.
b)
They are difficult to interpret with too many categories.
c)
They do not show percentage data.
d)
They can only display ordinal data.
| | K.L Institute answered |
One limitation of pie charts is that they become difficult to interpret when there are too many categories.
Typically, pie charts are best used for displaying data with six or fewer categories.
Typically, pie charts are best used for displaying data with six or fewer categories.
In a pie chart showing different categories of investments, what is the total degree measure for all slices combined?- a)180 degrees.
- b)360 degrees.
- c)90 degrees.
- d)270 degrees.
Correct answer is option 'B'. Can you explain this answer?
In a pie chart showing different categories of investments, what is the total degree measure for all slices combined?
a)
180 degrees.
b)
360 degrees.
c)
90 degrees.
d)
270 degrees.
 | BT Educators answered |
The total degree measure for all slices combined in a pie chart is always 360 degrees.
This represents the entire circle, corresponding to 100% of the data.
This represents the entire circle, corresponding to 100% of the data.
If a pie chart slice represents 25% of the total data, what is the angle of that slice in degrees?- a)90 degrees.
- b)60 degrees.
- c)75 degrees.
- d)90 degrees.
Correct answer is option 'A'. Can you explain this answer?
If a pie chart slice represents 25% of the total data, what is the angle of that slice in degrees?
a)
90 degrees.
b)
60 degrees.
c)
75 degrees.
d)
90 degrees.
| | T.S Academy answered |
If a pie chart slice represents 25% of the total data, the angle can be calculated as 25% of 360 degrees, which equals 90 degrees.
This is derived from the formula: (25/100) * 360 = 90 degrees.
This is derived from the formula: (25/100) * 360 = 90 degrees.
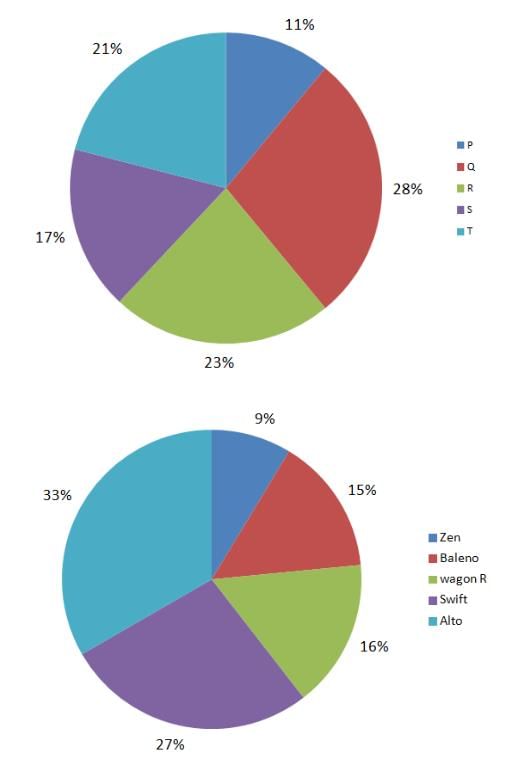
Instructions: On the basis of the information given below, answer the questions that follow.Maruti Suzuki has tie-ups with five dealers in Allahabad to sell their cars. The first pie chart given below gives the dealer-wise break-up of the number of cars sold by Maruti Suzuki in Allahabad in 2015. The second pie chart shows the model-wise breakup of the total cars sold by Maruti Suzuki in 2015 in Allahabad.

Q. If the dealer T sold an equal number of all five models of Maruti Suzuki then what is the maximum share(in %) that T can have in total sales of any model?(Enter only the integer value rounded off to nearest integer. Don’t put % sign)- a)27
- b)57
- c)47
- d)17
Correct answer is option 'C'. Can you explain this answer?
Instructions: On the basis of the information given below, answer the questions that follow.
Maruti Suzuki has tie-ups with five dealers in Allahabad to sell their cars. The first pie chart given below gives the dealer-wise break-up of the number of cars sold by Maruti Suzuki in Allahabad in 2015. The second pie chart shows the model-wise breakup of the total cars sold by Maruti Suzuki in 2015 in Allahabad.
Q. If the dealer T sold an equal number of all five models of Maruti Suzuki then what is the maximum share(in %) that T can have in total sales of any model?(Enter only the integer value rounded off to nearest integer. Don’t put % sign)
Q. If the dealer T sold an equal number of all five models of Maruti Suzuki then what is the maximum share(in %) that T can have in total sales of any model?(Enter only the integer value rounded off to nearest integer. Don’t put % sign)
a)
27
b)
57
c)
47
d)
17
 | Iq Funda answered |
If dealer T sold an equal number of each model, then for each model his share would be 4.2%.
Hence his share would be maximum for the model which had least share among the total sales.
The least share is for Zen which is 9%
Hence, the maximum share that T can have for any model = 4.2/9 × 100
= 46.67% which on rounding off becomes 47%.
Hence the required integral value to be entered is 47.
Instructions: On the basis of the information given below, answer the questions that follow.Maruti Suzuki has tie-ups with five dealers in Allahabad to sell their cars. The first pie chart given below gives the dealer-wise break-up of the number of cars sold by Maruti Suzuki in Allahabad in 2015. The second pie chart shows the model-wise breakup of the total cars sold by Maruti Suzuki in 2015 in Allahabad.
 Q. If the dealers R and S sold only Zen, Baleno and swift then at least what percentage of the Swifts sold, were sold by these two dealers alone? (Enter only the integer value rounded off to nearest integer. Don’t put % sign)
- a)63
- b)84
- c)59
- d)33
Correct answer is option 'C'. Can you explain this answer?
Instructions: On the basis of the information given below, answer the questions that follow.
Maruti Suzuki has tie-ups with five dealers in Allahabad to sell their cars. The first pie chart given below gives the dealer-wise break-up of the number of cars sold by Maruti Suzuki in Allahabad in 2015. The second pie chart shows the model-wise breakup of the total cars sold by Maruti Suzuki in 2015 in Allahabad.
Q. If the dealers R and S sold only Zen, Baleno and swift then at least what percentage of the Swifts sold, were sold by these two dealers alone? (Enter only the integer value rounded off to nearest integer. Don’t put % sign)
a)
63
b)
84
c)
59
d)
33
| | Iq Funda answered |
If the number of swifts sold by R and S is to be minimum, R and S should sell a maximum number of Baleno and Zen.
The share of R and S in total sales is 40%.
So even if they sell all Baleno’s and Zen that will account to only 24%, so they together will sell 16% Swifts.
The total share of swifts is 27% so they sold 16%.
Hence percentage share would be 16/27 × 100
= 59.25% which on rounding off becomes 59%. So correct answer is 59.
Instructions: The pie chart shown below gives the percentage distribution of car sales (in
numbers) between five companies – Maruti, Honda, Hyundai, Ford and Tata during the year 2014 – 2015. The total number of cars sold by the five companies together in 2014-2015 is four hundred thousand.
The line graph shown below gives the percentage distribution of the number of cars sold by each of the five companies in the four different Quarters of the year.
Q. In how many quarters were the number of cars sold by any two companies in that quarter the same?- a)0
- b)1
- c)3
- d)2
Correct answer is option 'D'. Can you explain this answer?
Instructions: The pie chart shown below gives the percentage distribution of car sales (in
numbers) between five companies – Maruti, Honda, Hyundai, Ford and Tata during the year 2014 – 2015. The total number of cars sold by the five companies together in 2014-2015 is four hundred thousand.
The line graph shown below gives the percentage distribution of the number of cars sold by each of the five companies in the four different Quarters of the year.
Q. In how many quarters were the number of cars sold by any two companies in that quarter the same?
a)
0
b)
1
c)
3
d)
2
 | G.K Academy answered |
The data given in the pie chart and the line chart can be tabulated into the following table (Data is in 000’s):
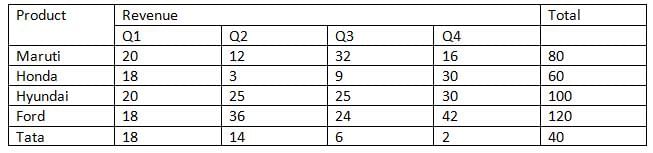
We can see that in Q1 and Q4 there are companies which sold equal number of cars. Thus, D is the right choice.
The following pie-chart shows the percentage distribution of the expenditure incurred in publishing a book. Study the pie-chart and the answer the questions based on it.Various Expenditures (in percentage) Incurred in Publishing a Book
 Q. The price of the book is marked 20% above the C.P. If the marked price of the book is Rs. 180, then what is the cost of the paper used in a single copy of the book?
- a)Rs. 36
- b)Rs. 42
- c)Rs. 37.50
- d)Rs. 44.25
Correct answer is option 'C'. Can you explain this answer?
The following pie-chart shows the percentage distribution of the expenditure incurred in publishing a book. Study the pie-chart and the answer the questions based on it.
Various Expenditures (in percentage) Incurred in Publishing a Book
Q. The price of the book is marked 20% above the C.P. If the marked price of the book is Rs. 180, then what is the cost of the paper used in a single copy of the book?
a)
Rs. 36
b)
Rs. 42
c)
Rs. 37.50
d)
Rs. 44.25
| | Upsc Rank Holders answered |
Clearly, marked price of the book = 120% of C.P.
Also, cost of paper = 25% of C.P
Let the cost of paper for a single book be Rs. n.
Then, 120 : 25 = 180 : n

Instructions Chart 1 shows the distribution by value of top 6 suppliers of MFA Textiles in 1995. Chart 2 shows the distribution by quantity of top 6 suppliers of MFA Textiles in 1995. The total value is 5760 million Euro (European currency). The total quantity is 1.055 million tonnes.
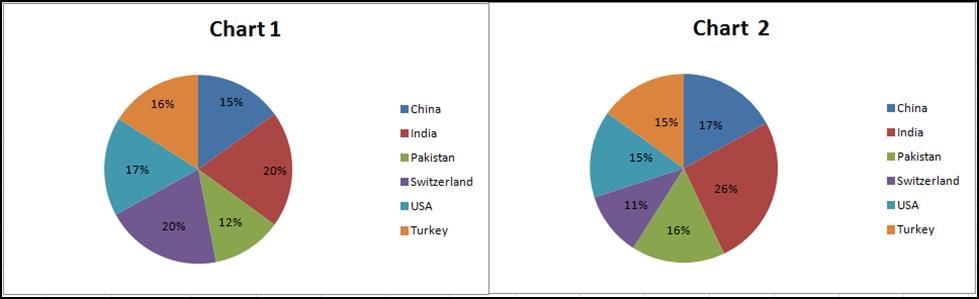 Q. The average price in Euro per kilogram for Turkey is roughly
- a)6.20
- b)4.80
- c)4.20
- d)5.60
Correct answer is option 'D'. Can you explain this answer?
Instructions
Chart 1 shows the distribution by value of top 6 suppliers of MFA Textiles in 1995. Chart 2 shows the distribution by quantity of top 6 suppliers of MFA Textiles in 1995. The total value is 5760 million Euro (European currency). The total quantity is 1.055 million tonnes.
Q. The average price in Euro per kilogram for Turkey is roughly
a)
6.20
b)
4.80
c)
4.20
d)
5.60
| | S.S Career Academy answered |
Turkey has a value of 16% and a quantity of 15%.
The average price in Euro per kilogram for Turkey is (16*5.760)/(15*1.055) which is nearly equal to 5.6.
Hence option D.
How do you convert a numerical value to a percentage for a pie chart?- a)Multiply the value by 100.
- b)Divide the value by the total and multiply by 100.
- c)Add the value to the total.
- d)Subtract the value from the total and multiply by 100.
Correct answer is option 'B'. Can you explain this answer?
How do you convert a numerical value to a percentage for a pie chart?
a)
Multiply the value by 100.
b)
Divide the value by the total and multiply by 100.
c)
Add the value to the total.
d)
Subtract the value from the total and multiply by 100.
| | BT Educators answered |
To convert a numerical value to a percentage for a pie chart, you divide the value by the total and then multiply by 100.
This gives the percentage that the value represents of the total.
This gives the percentage that the value represents of the total.
When constructing a pie chart, what is the first step you should take?- a)Calculate the total of all categories.
- b)Draw the pie chart.
- c)Determine the percentages of each category.
- d)Label the chart.
Correct answer is option 'A'. Can you explain this answer?
When constructing a pie chart, what is the first step you should take?
a)
Calculate the total of all categories.
b)
Draw the pie chart.
c)
Determine the percentages of each category.
d)
Label the chart.
| | K.L Institute answered |
The first step in constructing a pie chart is to calculate the total of all categories.
This total is necessary for determining the percentage of each category relative to the whole.
This total is necessary for determining the percentage of each category relative to the whole.
What is the approximate angle in degrees subtended by the arc of protein and dry elements in the human body, if they constitute 30% of the body?- a)54 degrees.
- b)108 degrees.
- c)126 degrees.
- d)252 degrees.
Correct answer is option 'B'. Can you explain this answer?
What is the approximate angle in degrees subtended by the arc of protein and dry elements in the human body, if they constitute 30% of the body?
a)
54 degrees.
b)
108 degrees.
c)
126 degrees.
d)
252 degrees.
| | Master Training Institute answered |
The angle subtended by the arc for protein and dry elements, which constitute 30% of the body, is calculated as (30/100) * 360, resulting in 108 degrees.
If a pie chart indicates that water constitutes 70% of a person's body weight, how much does water weigh in a 50 kg person?- a)20 kg.
- b)35 kg.
- c)41 kg.
- d)5 kg.
Correct answer is option 'B'. Can you explain this answer?
If a pie chart indicates that water constitutes 70% of a person's body weight, how much does water weigh in a 50 kg person?
a)
20 kg.
b)
35 kg.
c)
41 kg.
d)
5 kg.
| | BT Educators answered |
If water constitutes 70% of a person's body weight, in a 50 kg person, the weight of water would be 70% of 50 kg, which is 35 kg.
This calculation is made by multiplying 0.70 by 50.
This calculation is made by multiplying 0.70 by 50.
What type of data is most appropriately represented by a pie chart?- a)Continuous numerical data.
- b)Nominal or ordinal categorical data.
- c)Time series data.
- d)Interval data.
Correct answer is option 'B'. Can you explain this answer?
What type of data is most appropriately represented by a pie chart?
a)
Continuous numerical data.
b)
Nominal or ordinal categorical data.
c)
Time series data.
d)
Interval data.
 | Upsc Toppers answered |
Pie charts are most appropriate for nominal or ordinal categorical data.
They visually depict the relative sizes of different categories, making it easy to understand their proportions.
They visually depict the relative sizes of different categories, making it easy to understand their proportions.
Which pie chart variant is used to emphasize specific slices by separating them from the main pie?- a)Doughnut chart.
- b)Exploded pie chart.
- c)3D pie chart.
- d)Ring chart.
Correct answer is option 'B'. Can you explain this answer?
Which pie chart variant is used to emphasize specific slices by separating them from the main pie?
a)
Doughnut chart.
b)
Exploded pie chart.
c)
3D pie chart.
d)
Ring chart.
| | T.S Academy answered |
An exploded pie chart is used to emphasize specific slices by separating them from the main pie.
This visual effect helps highlight particular categories within the overall data.
This visual effect helps highlight particular categories within the overall data.
Which pie chart type allows for a hollow center to emphasize the data represented?- a)3D pie chart.
- b)Doughnut chart.
- c)Exploded pie chart.
- d)Standard pie chart.
Correct answer is option 'B'. Can you explain this answer?
Which pie chart type allows for a hollow center to emphasize the data represented?
a)
3D pie chart.
b)
Doughnut chart.
c)
Exploded pie chart.
d)
Standard pie chart.
| | Lohit Matani answered |
The doughnut chart has a hollow center, allowing for an emphasis on the data represented in the slices.
This format can enhance readability and focus on specific categories.
This format can enhance readability and focus on specific categories.
What percentage of total investment comes from both FII’s and NRI’s combined if FII’s account for 33% and NRI's for 11%?- a)44%.
- b)33%.
- c)11%.
- d)22%.
Correct answer is option 'A'. Can you explain this answer?
What percentage of total investment comes from both FII’s and NRI’s combined if FII’s account for 33% and NRI's for 11%?
a)
44%.
b)
33%.
c)
11%.
d)
22%.
| | Master Training Institute answered |
The percentage of total investment coming from both FII’s and NRI’s combined is 33% + 11%, which equals 44%.
This highlights the combined contribution of these two categories to total investments.
This highlights the combined contribution of these two categories to total investments.
In a pie chart, how do you calculate the central angle for each category?- a)Divide the category value by the total and multiply by 100.
- b)Divide the category value by the total and multiply by 360.
- c)Multiply the category value by the total.
- d)Subtract the category value from the total.
Correct answer is option 'B'. Can you explain this answer?
In a pie chart, how do you calculate the central angle for each category?
a)
Divide the category value by the total and multiply by 100.
b)
Divide the category value by the total and multiply by 360.
c)
Multiply the category value by the total.
d)
Subtract the category value from the total.
| | Upsc Toppers answered |
To calculate the central angle for each category in a pie chart, divide the category value by the total and multiply by 360.
This gives the angle that corresponds to the category's proportion of the total.
This gives the angle that corresponds to the category's proportion of the total.
Instructions: On the basis of the information given below, answer the questions that follow.Maruti Suzuki has tie-ups with five dealers in Allahabad to sell their cars. The first pie chart given below gives the dealer-wise break-up of the number of cars sold by Maruti Suzuki in Allahabad in 2015. The second pie chart shows the model-wise breakup of the total cars sold by Maruti Suzuki in 2015 in Allahabad.
 Q. If for any dealer, the percentage of Wagon R’s sold by him did not exceed 25% of his total sales, then at least how many dealers sold Wagon R?
- a)8
- b)3
- c)11
- d)17
Correct answer is option 'B'. Can you explain this answer?
Instructions: On the basis of the information given below, answer the questions that follow.
Maruti Suzuki has tie-ups with five dealers in Allahabad to sell their cars. The first pie chart given below gives the dealer-wise break-up of the number of cars sold by Maruti Suzuki in Allahabad in 2015. The second pie chart shows the model-wise breakup of the total cars sold by Maruti Suzuki in 2015 in Allahabad.
Q. If for any dealer, the percentage of Wagon R’s sold by him did not exceed 25% of his total sales, then at least how many dealers sold Wagon R?
a)
8
b)
3
c)
11
d)
17
| | Iq Funda answered |
We have to minimize the number of dealers who sold Wagon R.
So to minimize the number of dealers, the dealers who have largest share in total sales should have maximum share of Wagon R.
So if we assume that Q and R sold Wagon R the maximum number of Wagon R’s they can sell is 25% of 51 which is equal to 12.75%.
But the overall share of Wagon R is 16% so there should be at least 1 more dealer who sells Wagon R.
Hence the correct answer is 3.
Instructions:
For the following three questions: Answer the questions based on the pie charts given below. Chart 1 shows the distribution of 12 million tonnes of crude oil transported through different modes over a specific period of time. Chart 2 shows the distribution of the cost of transporting this crude oil. The total cost was Rs. 30 million.
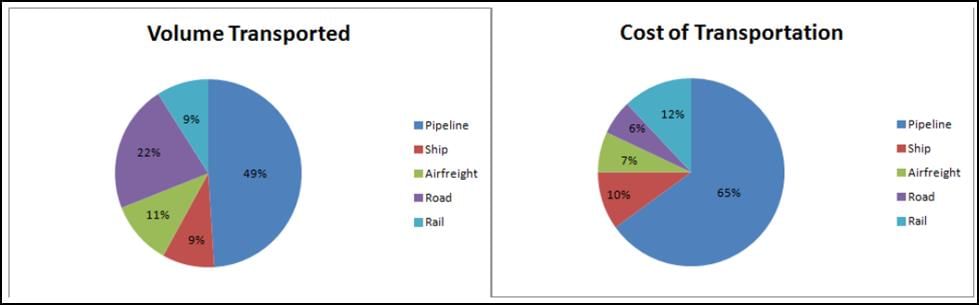 Q. From the charts given, it appears that the cheapest mode of transport is
- a)road
- b)rail
- c)pipeline
- d)ship
Correct answer is option 'A'. Can you explain this answer?
Instructions:
For the following three questions: Answer the questions based on the pie charts given below. Chart 1 shows the distribution of 12 million tonnes of crude oil transported through different modes over a specific period of time. Chart 2 shows the distribution of the cost of transporting this crude oil. The total cost was Rs. 30 million.
Q. From the charts given, it appears that the cheapest mode of transport is
a)
road
b)
rail
c)
pipeline
d)
ship
 | Innovative Classes answered |
Cheapest mode of transport will be the one which will have highest transport volume and comparatively lowest cost.
We can figure out from the graph that Road have wide gap with very less costs.
For Road, Cost = 6/22
For Rail, Cost = 12/9
For Pipeline, = 65/49
For Ship, Cost = 10/9
Lowest cost is for road.
Instructions Chart 1 shows the distribution by value of top 6 suppliers of MFA Textiles in 1995. Chart 2 shows the distribution by quantity of top 6 suppliers of MFA Textiles in 1995. The total value is 5760 million Euro (European currency). The total quantity is 1.055 million tonnes.
 Q. The country which has the highest average price is
- a)Switzerland
- b)USA
- c)Turkey
- d)India
Correct answer is option 'A'. Can you explain this answer?
Instructions
Chart 1 shows the distribution by value of top 6 suppliers of MFA Textiles in 1995. Chart 2 shows the distribution by quantity of top 6 suppliers of MFA Textiles in 1995. The total value is 5760 million Euro (European currency). The total quantity is 1.055 million tonnes.
Q. The country which has the highest average price is
a)
Switzerland
b)
USA
c)
Turkey
d)
India
 | EduRev CLAT answered |
The country which has the highest average price would have low quality and high value when compared to other countries..
Switzerland fits the above description.
Hence, option A is the answer.
Chapter doubts & questions for Pie Charts - 6 Months Preparation Course for OPSC 2026 is part of OPSC OCS (Odisha) exam preparation. The chapters have been prepared according to the OPSC OCS (Odisha) exam syllabus. The Chapter doubts & questions, notes, tests & MCQs are made for OPSC OCS (Odisha) 2026 Exam. Find important definitions, questions, notes, meanings, examples, exercises, MCQs and online tests here.
Chapter doubts & questions of Pie Charts - 6 Months Preparation Course for OPSC in English & Hindi are available as part of OPSC OCS (Odisha) exam. Download more important topics, notes, lectures and mock test series for OPSC OCS (Odisha) Exam by signing up for free.
6 Months Preparation Course for OPSC636 videos|2472 docs|801 tests |