


All Exams > Class 8 > Mathematics (Maths) Class 8 > All Questions
All questions of Data Handling for Class 8 Exam
There are 2 Red, 3 Blue and 5 Black balls in a bag. A ball is drawn from the bag without looking in to the bag. What is the probability of getting a black ball?- a)3/5
- b)2/5
- c)1/2
- d)None of these
Correct answer is option 'C'. Can you explain this answer?
There are 2 Red, 3 Blue and 5 Black balls in a bag. A ball is drawn from the bag without looking in to the bag. What is the probability of getting a black ball?
a)
3/5
b)
2/5
c)
1/2
d)
None of these
 | EduRev Class 8 answered |
total no of black ball / total no of balls
5 / 10
1 / 2
5 / 10
1 / 2

When a die is thrown, total number of possible outcomes is ______.- a)6
- b)36
- c)2
- d)None of these
Correct answer is option 'A'. Can you explain this answer?
When a die is thrown, total number of possible outcomes is ______.
a)
6
b)
36
c)
2
d)
None of these
| | EduRev Class 8 answered |
When a die is thrown, the total number of possible outcomes is:
- Each face of a standard die is numbered from 1 to 6.
- When you throw the die, it can land on any one of these six faces.
- This means there are six different possible outcomes.
So, the correct answer is:
A: 6
A: 6
18 out of 36 people love reading, so reading in the pie chart will be represented by- a)36 degree sector
- b)quarter sector
- c)semi circular sector
- d)None of these
Correct answer is option 'C'. Can you explain this answer?
18 out of 36 people love reading, so reading in the pie chart will be represented by
a)
36 degree sector
b)
quarter sector
c)
semi circular sector
d)
None of these
| | Rashmi Choudhary answered |
When we find the central angel on pie chart we get 18/36*360•=180•which is half of pie.so we write that semi circular sector love reading.
There are 2 Red, 3 Blue and 5 Black balls in a bag. A ball is drawn from the bag without looking in to the bag. What is the probability of getting a non-red ball?- a)3/5
- b)4/5
- c)2/5
- d)None of these
Correct answer is option 'B'. Can you explain this answer?
There are 2 Red, 3 Blue and 5 Black balls in a bag. A ball is drawn from the bag without looking in to the bag. What is the probability of getting a non-red ball?
a)
3/5
b)
4/5
c)
2/5
d)
None of these
| | Amit Kumar answered |
Non - red ball = 8
Probability = No of non red balls/Total no. of outcomes
= 8/10 = 4/5
Probability = No of non red balls/Total no. of outcomes
= 8/10 = 4/5
The central total angle in a pie chart is- a)180°
- b)210°
- c)360°
- d)None of these
Correct answer is option 'C'. Can you explain this answer?
The central total angle in a pie chart is
a)
180°
b)
210°
c)
360°
d)
None of these
| | EduRev Class 8 answered |
The central total angle in a pie chart is:
- The correct answer is C: 360°.
- A pie chart represents data in a circular format, where the entire circle makes up 100% of the data.
- A full circle has an angle of 360 degrees.
- Each segment or "slice" of the pie chart corresponds to a part of the total 360°.
When a coin is thrown, total number of possible outcomes is ______.- a)2
- b)5
- c)6
- d)None of these
Correct answer is option 'A'. Can you explain this answer?
When a coin is thrown, total number of possible outcomes is ______.
a)
2
b)
5
c)
6
d)
None of these
 | Trisha Vashisht answered |
- When a coin is thrown, there are two possible outcomes: Heads or Tails.
- Each side of the coin represents one outcome.
- Thus, the total number of possible outcomes is 2.
- Therefore, the correct answer is A: 2.
- Each side of the coin represents one outcome.
- Thus, the total number of possible outcomes is 2.
- Therefore, the correct answer is A: 2.
There are 2 Red, 3 Blue and 5 Black balls in a bag. A ball is drawn from the bag without looking in to the bag. What is the probability of getting a blue ball?- a)3/5
- b)2/5
- c)3/10
- d)None of these
Correct answer is option 'C'. Can you explain this answer?
There are 2 Red, 3 Blue and 5 Black balls in a bag. A ball is drawn from the bag without looking in to the bag. What is the probability of getting a blue ball?
a)
3/5
b)
2/5
c)
3/10
d)
None of these
| | Krishna Singi answered |
Because
no. of ball/TOTAL no of ball
3/10
HENCE OPTION C 3/10 OS THE CORRECT ANSWER
no. of ball/TOTAL no of ball
3/10
HENCE OPTION C 3/10 OS THE CORRECT ANSWER
There are 2 Red, 3 Blue and 5 Black balls in a bag. A ball is drawn from the bag without looking in to the bag. What is the probability of getting a red ball?- a)2/5
- b)3/5
- c)1/5
- d)None of these
Correct answer is option 'C'. Can you explain this answer?
There are 2 Red, 3 Blue and 5 Black balls in a bag. A ball is drawn from the bag without looking in to the bag. What is the probability of getting a red ball?
a)
2/5
b)
3/5
c)
1/5
d)
None of these
| | Sahil Unni answered |
Problem: There are 2 Red, 3 Blue, and 5 Black balls in a bag. A ball is drawn from the bag without looking into the bag. What is the probability of getting a red ball?
Solution:
To find the probability of getting a red ball, we need to determine the number of favorable outcomes (red balls) and the total number of possible outcomes (total balls).
Favorable outcomes:
There are 2 red balls in the bag.
Total outcomes:
There are a total of 2 red balls + 3 blue balls + 5 black balls = 10 balls in the bag.
Therefore, the probability of getting a red ball can be calculated as:
Probability = (Number of favorable outcomes) / (Total number of outcomes)
= 2 / 10
= 1 / 5
Therefore, the probability of getting a red ball is 1/5 or option 'C' in the given options.
Two dice are thrown, find and number of outcomes.- a)36
- b)6
- c)12
- d)None of these
Correct answer is option 'A'. Can you explain this answer?
Two dice are thrown, find and number of outcomes.
a)
36
b)
6
c)
12
d)
None of these
| | Kavya Saxena answered |
We know that in a single thrown of two die, the total number of possible outcomes is (6 × 6) = 36. Let S be the sample space. Then, n(S) = 36
When two dice are thrown, each die has 6 faces, numbered from 1 to 6. To find the total number of outcomes when both dice are thrown, you can use the multiplication principle.
- Outcomes for the first die: There are 6 possible outcomes (1, 2, 3, 4, 5, 6).
- Outcomes for the second die: Similarly, there are also 6 possible outcomes.
To find the total number of outcomes when both dice are thrown, multiply the number of outcomes for the first die by the number of outcomes for the second die:
Total Outcomes=Outcomes for the first die×Outcomes for the second die=6×6=36\text{Total Outcomes} = \text{Outcomes for the first die} \times \text{Outcomes for the second die} = 6 \times 6 = 36Total Outcomes=Outcomes for the first die×Outcomes for the second die=6×6=36
Conclusion
So, when two dice are thrown, there are a total of 36 possible outcomes. Each outcome can be represented as an ordered pair (x, y), where x is the result from the first die and y is the result from the second die. For example, (1, 1), (1, 2), ..., (6, 6).
What does data handling involve?- a)Only collecting data
- b)Collecting, organizing, analyzing, and interpreting data
- c)Only interpreting data
- d)Only analyzing data
Correct answer is option 'B'. Can you explain this answer?
What does data handling involve?
a)
Only collecting data
b)
Collecting, organizing, analyzing, and interpreting data
c)
Only interpreting data
d)
Only analyzing data
 | C K Academy answered |
Data handling involves several key processes:
- Collecting data from various sources.
- Organizing the data to make it manageable.
- Analyzing the data to extract meaningful information.
- Interpreting the data to draw conclusions or make decisions.
Thus, the correct answer is collecting, organizing, analyzing, and interpreting data.
The pie- chart is divided into- a)circles
- b)squares
- c)sectors
- d)segments
Correct answer is option 'C'. Can you explain this answer?
The pie- chart is divided into
a)
circles
b)
squares
c)
sectors
d)
segments
 | Ashwin Jain answered |
A pie chart (or a circle chart) is a circular statistical graphic which is divided into slices to illustrate numerical proportion. In a pie chart, the arc length of each slice (and consequently its central angle and area), is proportional to the quantity it represents.
There are 2 Red, 3 Blue and 5 Black balls in a bag. A ball is drawn from the bag without looking in to the bag. What is the probability of getting a non-black ball?- a)3/5
- b)2/5
- c)1/2
- d)None of these
Correct answer is option 'C'. Can you explain this answer?
There are 2 Red, 3 Blue and 5 Black balls in a bag. A ball is drawn from the bag without looking in to the bag. What is the probability of getting a non-black ball?
a)
3/5
b)
2/5
c)
1/2
d)
None of these
| | Akshay Menon answered |
Understanding the Problem
In this problem, we have a total of balls in the bag:
- 2 Red balls
- 3 Blue balls
- 5 Black balls
We need to find the probability of drawing a non-black ball.
Total Number of Balls
To calculate the total number of balls in the bag, we sum up all the balls:
- Total = Red + Blue + Black
- Total = 2 + 3 + 5 = 10 balls
Identifying Non-Black Balls
Next, we determine the number of non-black balls:
- Non-black balls = Red + Blue
- Non-black balls = 2 + 3 = 5 balls
Calculating the Probability
The probability of an event is defined as the number of favorable outcomes divided by the total number of possible outcomes. In our case:
- Favorable outcomes = Number of non-black balls = 5
- Total outcomes = Total number of balls = 10
Thus, the probability of drawing a non-black ball is:
Probability = (Number of non-black balls) / (Total number of balls)
Probability = 5 / 10
Simplifying the Probability
Now, we simplify the fraction:
- 5 / 10 = 1 / 2
Conclusion
The probability of drawing a non-black ball is 1/2, which corresponds to option 'C'.
If the total number of people are 400 then how many of them like tea?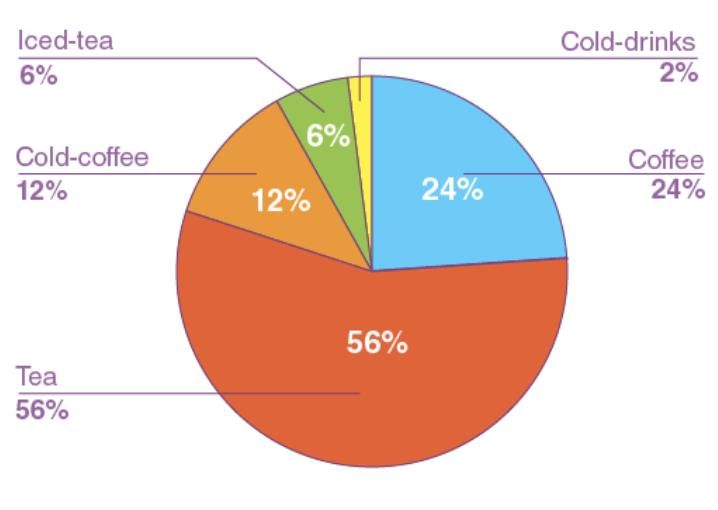
- a)224
- b)565
- c)555
- d)245
Correct answer is option 'A'. Can you explain this answer?
If the total number of people are 400 then how many of them like tea?
a)
224
b)
565
c)
555
d)
245
| | C K Academy answered |
Total number of people = 400
Number of people like tea = 400 × 56/100 = 224
What does a circle graph represent?- a)Relationships between two datasets
- b)Frequency distribution
- c)Relationship between a whole and its part
- d)Data over time
Correct answer is option 'C'. Can you explain this answer?
What does a circle graph represent?
a)
Relationships between two datasets
b)
Frequency distribution
c)
Relationship between a whole and its part
d)
Data over time
| | Geetika Datta answered |
Understanding Circle Graphs
Circle graphs, also known as pie charts, are visual tools that effectively represent data by illustrating the relationship between a whole and its parts. This makes option 'C' the correct answer.
Key Features of Circle Graphs:
- Representation of Parts: Circle graphs divide a circle into sectors, with each sector corresponding to a specific category or part of the whole. The size of each sector is proportional to the quantity it represents.
- Visual Clarity: They provide a clear visual representation of how different parts contribute to the total. This makes it easier for viewers to grasp proportions at a glance.
- Data Summarization: Circle graphs summarize large sets of data, making complex information more digestible. For instance, if a survey indicates how students prefer different subjects, a circle graph can easily show the percentage of students favoring each subject.
- Comparison of Categories: While circle graphs are primarily about parts of a whole, they also facilitate comparison between different categories. This allows for quick assessment of which parts are larger or smaller relative to others.
When to Use Circle Graphs:
- Proportional Data: Ideal for data that represents parts of a whole, such as budget allocations, market shares, or demographic distributions.
- Limited Categories: Best used when there are a limited number of categories (generally less than six) to avoid clutter and maintain clarity.
In conclusion, circle graphs are powerful tools for displaying the relationship between a whole and its parts, making them invaluable for visualizing proportional data effectively.
What is another name for a circle graph?- a)Bar graph
- b)Line graph
- c)Pie chart
- d)Scatter plot
Correct answer is option 'C'. Can you explain this answer?
What is another name for a circle graph?
a)
Bar graph
b)
Line graph
c)
Pie chart
d)
Scatter plot
| | Dipika Bajaj answered |
Understanding Circle Graphs
A circle graph, commonly known as a pie chart, is a graphical representation used to display data in a circular format. It visually illustrates the proportions of different categories within a whole.
Why is it called a Pie Chart?
- The name "pie chart" comes from its resemblance to a pie, which is divided into slices.
- Each slice represents a category's contribution to the total, making it easy to compare parts of the whole.
Characteristics of Pie Charts
- Circular Shape: The chart is circular, representing 100% of the data.
- Slices: Each slice corresponds to a percentage of the total, which can be visually interpreted.
- Color-Coded: Different colors are often used for each slice to differentiate between categories.
When to Use Pie Charts
- Proportional Data: Ideal for showing how much each category contributes to the total.
- Limited Categories: Best used when you have a small number of categories, as too many slices can make it hard to read.
Comparison with Other Graphs
- Bar Graph: Displays data with rectangular bars, good for comparing quantities across categories.
- Line Graph: Shows trends over time, using points connected by lines.
- Scatter Plot: Displays values for two variables, showing relationships between them.
In summary, a circle graph is effectively termed a pie chart due to its pie-like appearance and is particularly useful for visualizing proportional data in a clear and engaging way.
Why is it necessary to organize data systematically?- a)To make it visually appealing
- b)To ensure meaningful inferences can be drawn
- c)To increase the volume of data
- d)To remove incorrect data
Correct answer is option 'B'. Can you explain this answer?
Why is it necessary to organize data systematically?
a)
To make it visually appealing
b)
To ensure meaningful inferences can be drawn
c)
To increase the volume of data
d)
To remove incorrect data
| | EduRev Class 8 answered |
Answer: (b) To ensure meaningful inferences can be drawn
- Systematically organizing data helps in identifying patterns, trends, and relationships within the data.
- It facilitates efficient analysis and interpretation, allowing for accurate conclusions.
- Structured data presentation aids in communicating findings to others, ensuring clarity and understanding.
- It enhances decision-making processes by providing a clear basis for deriving insights.
What is an event in probability?- a)An impossible outcome
- b)One or more outcomes of an experiment
- c)A fixed outcome
- d)An unequal outcome
Correct answer is option 'B'. Can you explain this answer?
What is an event in probability?
a)
An impossible outcome
b)
One or more outcomes of an experiment
c)
A fixed outcome
d)
An unequal outcome
| | Trisha Vashisht answered |
An event in probability refers to one or more outcomes of an experiment. Here's why option B is correct:
- An event is a set of possible outcomes from a probability experiment.
- For example, when rolling a die, an event could be rolling an even number, which includes the outcomes 2, 4, or 6.
- Events can be simple (a single outcome) or compound (multiple outcomes).
- Understanding events is crucial for calculating probabilities in various scenarios.


There are 2 Red, 3 Blue and 5 Black balls in a bag. A ball is drawn from the bag without looking in to the bag. What is the probability of getting a non-blue ball?- a)7/10
- b)3/5
- c)2/5
- d)None of these
Correct answer is option 'A'. Can you explain this answer?
There are 2 Red, 3 Blue and 5 Black balls in a bag. A ball is drawn from the bag without looking in to the bag. What is the probability of getting a non-blue ball?
a)
7/10
b)
3/5
c)
2/5
d)
None of these
| | EduRev Class 8 answered |
a) 7/10
Total balls = 2 (Red) + 3 (Blue) + 5 (Black) = 10
Non-blue balls = Red + Black = 2 + 5 = 7
Probability of non-blue = favorable / total = 7/10.
Non-blue balls = Red + Black = 2 + 5 = 7
Probability of non-blue = favorable / total = 7/10.
(Complement check: 1 − P(Blue) = 1 − 3/10 = 7/10
Chapter doubts & questions for Data Handling - Mathematics (Maths) Class 8 2026 is part of Class 8 exam preparation. The chapters have been prepared according to the Class 8 exam syllabus. The Chapter doubts & questions, notes, tests & MCQs are made for Class 8 2026 Exam. Find important definitions, questions, notes, meanings, examples, exercises, MCQs and online tests here.
Chapter doubts & questions of Data Handling - Mathematics (Maths) Class 8 in English & Hindi are available as part of Class 8 exam. Download more important topics, notes, lectures and mock test series for Class 8 Exam by signing up for free.
Mathematics (Maths) Class 8112 videos|670 docs|49 tests |