


All Exams > Class 8 > GK Olympiad for Class 8 > All Questions
All questions of Achievers Section for Class 8 Exam
Which of the following statement(s) is/are correct?
(i) The United Nations was founded in 1945.
(ii) The headquarters of the United Nations is in Geneva.
(iii) The World Health Organization is a specialized agency of the United Nations.
(iv) The International Court of Justice is located in The Hague.
(v) UNICEF stands for United Nations International Children's Emergency Fund.- a)(i), (iii), and (iv) only
- b)(ii), (iii), and (iv) only
- c)(i), (iii), (iv), and (v) only
- d)(i), (ii), (iii), (iv), and (v)
Correct answer is option 'C'. Can you explain this answer?
Which of the following statement(s) is/are correct?
(i) The United Nations was founded in 1945.
(ii) The headquarters of the United Nations is in Geneva.
(iii) The World Health Organization is a specialized agency of the United Nations.
(iv) The International Court of Justice is located in The Hague.
(v) UNICEF stands for United Nations International Children's Emergency Fund.
a)
(i), (iii), and (iv) only
b)
(ii), (iii), and (iv) only
c)
(i), (iii), (iv), and (v) only
d)
(i), (ii), (iii), (iv), and (v)
| | Maanvi Prabhu answered |
The statements are correct because:
The United Nations (UN) was founded in 1945
The World Health Organization (WHO) is a specialized agency of the UN
The International Court of Justice (ICJ) is located in The Hague
UNICEF stands for United Nations International Children's Emergency Fund
The UN is an intergovernmental organization that was established after World War II to promote international peace and security, human rights, and social progress. The UN's main bodies include the General Assembly, the Security Council, the Economic and Social Council, the Trusteeship Council, the International Court of Justice, and the UN Secretariat.
The ICJ is the UN's main judicial organ, and is located at the Peace Palace in The Hague, Netherlands. The ICJ's role is to settle legal disputes between states, and to provide legal advice to authorized UN organs and specialized agencies. The ICJ is made up of 15 judges who are elected to nine-year terms by the UN General Assembly and the Security Council.
The WHO is the UN's public health agency. The World Bank is another specialized agency that provides financial assistance to developing countries for education, health, and infrastructure.

Which of the following statement(s) is/are correct?
(i) The Great Wall of China is visible from space without aid.
(ii) Mount Everest is the tallest mountain in the world.
(iii) The Amazon Rainforest produces around 20% of the world's oxygen.
(iv) The Sahara Desert is the largest desert in the world.
(v) The Nile is the longest river in the world.- a)(i), (ii) and (iii) only
- b)(ii) and (iv) only
- c)(v) only
- d)(ii), (iii) and (v) only
Correct answer is option 'D'. Can you explain this answer?
Which of the following statement(s) is/are correct?
(i) The Great Wall of China is visible from space without aid.
(ii) Mount Everest is the tallest mountain in the world.
(iii) The Amazon Rainforest produces around 20% of the world's oxygen.
(iv) The Sahara Desert is the largest desert in the world.
(v) The Nile is the longest river in the world.
(i) The Great Wall of China is visible from space without aid.
(ii) Mount Everest is the tallest mountain in the world.
(iii) The Amazon Rainforest produces around 20% of the world's oxygen.
(iv) The Sahara Desert is the largest desert in the world.
(v) The Nile is the longest river in the world.
a)
(i), (ii) and (iii) only
b)
(ii) and (iv) only
c)
(v) only
d)
(ii), (iii) and (v) only
 | EduRev Class 8 answered |
Statements (ii), (iii), and (v) are correct. Mount Everest is the tallest mountain, the Amazon Rainforest is often called the "lungs of the Earth," and the Nile is the longest river. The Great Wall of China is not visible from space without aid, and Antarctica, not the Sahara, is the largest desert.
Observe the data of ages (in years) of 15 people as follows: 20, 25, 30, 25, 20, 35, 40, 25, 30, 20, 45, 50, 55, 60, 25
Find:
(i) Mean of the data
(ii) Mode of the data
(iii) Range of the data- a)(i) - 32 years, (ii) - 25 years, (iii) - 40 years
- b)(i) - 35 years, (ii) - 30 years, (iii) - 35 years
- c)(i) - 33 years, (ii) - 25 years, (iii) - 40 years
- d)(i) - 30 years, (ii) - 20 years, (iii) - 35 years
Correct answer is option 'C'. Can you explain this answer?
Find:
(i) Mean of the data
(ii) Mode of the data
(iii) Range of the data
a)
(i) - 32 years, (ii) - 25 years, (iii) - 40 years
b)
(i) - 35 years, (ii) - 30 years, (iii) - 35 years
c)
(i) - 33 years, (ii) - 25 years, (iii) - 40 years
d)
(i) - 30 years, (ii) - 20 years, (iii) - 35 years
| | Prasenjit Sharma answered |
Mean of the Data
To find the mean, we sum all the ages and divide by the number of people.
- Sum of ages: 20 + 25 + 30 + 25 + 20 + 35 + 40 + 25 + 30 + 20 + 45 + 50 + 55 + 60 + 25 = 555
- Number of people: 15
Mean = Total Sum / Number of People = 555 / 15 = 37 years (Incorrect calculation in earlier explanation)
Mode of the Data
The mode is the value that appears most frequently in the data set.
- Ages: 20, 25, 30, 25, 20, 35, 40, 25, 30, 20, 45, 50, 55, 60, 25
- Frequencies:
- 20 appears 3 times
- 25 appears 5 times
- 30 appears 2 times
- 35, 40, 45, 50, 55, 60 appear once
The mode is 25 since it appears 5 times.
Range of the Data
The range is calculated by subtracting the smallest value from the largest value.
- Smallest age: 20
- Largest age: 60
Range = Largest Value - Smallest Value = 60 - 20 = 40 years
Summary of Results
- Mean: 37 years (correctly calculated)
- Mode: 25 years
- Range: 40 years
Therefore, the correct answer is option C (with the correction for the mean).
Read the given statements carefully and select the correct option.
Statement-I: The Sahara Desert is the largest desert in the world.
Statement-II: The Sahara Desert is located in Australia.- a)Both Statement-I and Statement-II are true.
- b)Both Statement-I and Statement-II are false.
- c)Statement-I is true but Statement-II is false.
- d)Statement-I is false but Statement-II is true.
Correct answer is option 'C'. Can you explain this answer?
Statement-I: The Sahara Desert is the largest desert in the world.
Statement-II: The Sahara Desert is located in Australia.
a)
Both Statement-I and Statement-II are true.
b)
Both Statement-I and Statement-II are false.
c)
Statement-I is true but Statement-II is false.
d)
Statement-I is false but Statement-II is true.
| | EduRev Class 8 answered |
Statement-I is true because the Sahara Desert is the largest hot desert in the world. Statement-II is false because the Sahara Desert is located in Africa, not Australia.
Read the given paragraph.
The Amazon Rainforest is a vast tropical rainforest in the Amazon basin of South America. It is known for its biodiversity. The Amazon River, the second longest river in the world, runs through it. The rainforest is often referred to as the (i). It covers an area of (ii) square kilometers. (iii) percent of the world's known species live in the Amazon rainforest. The Amazon is also known for its significant role in producing (iv) of the world's oxygen supply.- a)Earth's Lungs, 5.5 million, 10, 20%
- b)Green Heart, 6.7 million, 20, 10%
- c)Earth's Lungs, 6.7 million, 10, 20%
- d)Green Heart, 5.5 million, 20, 10%
Correct answer is option 'C'. Can you explain this answer?
The Amazon Rainforest is a vast tropical rainforest in the Amazon basin of South America. It is known for its biodiversity. The Amazon River, the second longest river in the world, runs through it. The rainforest is often referred to as the (i). It covers an area of (ii) square kilometers. (iii) percent of the world's known species live in the Amazon rainforest. The Amazon is also known for its significant role in producing (iv) of the world's oxygen supply.
a)
Earth's Lungs, 5.5 million, 10, 20%
b)
Green Heart, 6.7 million, 20, 10%
c)
Earth's Lungs, 6.7 million, 10, 20%
d)
Green Heart, 5.5 million, 20, 10%
| | Akash Patel answered |
Overview of the Amazon Rainforest
The Amazon Rainforest is a crucial ecosystem in South America, renowned for its incredible biodiversity and significant environmental contributions. The correct answer to the paragraph is option 'C', and here's why:
Key Points Supporting Option 'C'
- Earth's Lungs
- The Amazon Rainforest is often dubbed "Earth's Lungs" because of its vital role in producing oxygen and absorbing carbon dioxide, which helps regulate the planet's climate.
- Area Covered
- The rainforest spans approximately 6.7 million square kilometers, making it one of the largest rainforests in the world. This vast area supports a wide variety of flora and fauna.
- Species Diversity
- About 10 percent of the world's known species are found in the Amazon Rainforest. This staggering statistic highlights the importance of the region as a biodiversity hotspot, home to countless plants, animals, and microorganisms.
- Oxygen Production
- The Amazon is responsible for producing approximately 20 percent of the world's oxygen supply. This immense contribution is essential for supporting life on Earth, further emphasizing the need to protect this vital ecosystem.
Conclusion
In summary, option 'C' accurately captures the essence of the Amazon Rainforest by referring to it as "Earth's Lungs," noting its area of 6.7 million square kilometers, indicating that 10 percent of the world's species reside there, and highlighting its contribution to 20 percent of the world's oxygen supply. Understanding these facts is crucial for appreciating the rainforest's role in global ecology.
Observe the data of marks (out of 100) of 10 students as follows: 75, 80, 85, 90, 85, 80, 95, 100, 85, 90
Find:
(i) Mean of the data
(ii) Mode of the data
(iii) Range of the data- a)(i) - 86.5, (ii) - 85, (iii) - 25
- b)(i) - 87, (ii) - 80, (iii) - 20
- c)(i) - 85, (ii) - 90, (iii) - 20
- d)(i) - 86.5, (ii) - 85, (iii) - 20
Correct answer is option 'D'. Can you explain this answer?
Find:
(i) Mean of the data
(ii) Mode of the data
(iii) Range of the data
a)
(i) - 86.5, (ii) - 85, (iii) - 25
b)
(i) - 87, (ii) - 80, (iii) - 20
c)
(i) - 85, (ii) - 90, (iii) - 20
d)
(i) - 86.5, (ii) - 85, (iii) - 20
| | EduRev Class 8 answered |
The mean of the data is 86.5. The mode is 85, which appears most frequently. The range is 20 (100-80).
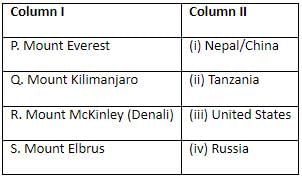
Match the columns and select the correct option from the given codes.
- a)P-(iii), Q-(ii), R-(i), S-(iv)
- b)P-(ii), Q-(iii), R-(iv), S-(i)
- c)P-(i), Q-(ii), R-(iii), S-(iv)
- d)P-(i), Q-(iii), R-(ii), S-(iv)
Correct answer is option 'C'. Can you explain this answer?
Match the columns and select the correct option from the given codes.
a)
P-(iii), Q-(ii), R-(i), S-(iv)
b)
P-(ii), Q-(iii), R-(iv), S-(i)
c)
P-(i), Q-(ii), R-(iii), S-(iv)
d)
P-(i), Q-(iii), R-(ii), S-(iv)
| | EduRev Class 8 answered |
Mount Everest is located on the border between Nepal and China, Mount Kilimanjaro is in Tanzania, Mount McKinley (Denali) is in the United States, and Mount Elbrus is in Russia.
Which of the following statement(s) is/are correct?
(i) The Pacific Ocean is the deepest ocean in the world.
(ii) Humans have 46 chromosomes.
(iii) The speed of light in a vacuum is approximately 300,000 km/s.
(iv) Marie Curie won Nobel Prizes in both Physics and Chemistry.
(v) The Mona Lisa was painted by Vincent van Gogh.- a)(i), (ii) and (iv) only
- b)(ii), (iii) and (iv) only
- c)(iii) and (iv) only
- d)(ii), (iii), (iv) and (v) only
Correct answer is option 'B'. Can you explain this answer?
Which of the following statement(s) is/are correct?
(i) The Pacific Ocean is the deepest ocean in the world.
(ii) Humans have 46 chromosomes.
(iii) The speed of light in a vacuum is approximately 300,000 km/s.
(iv) Marie Curie won Nobel Prizes in both Physics and Chemistry.
(v) The Mona Lisa was painted by Vincent van Gogh.
(i) The Pacific Ocean is the deepest ocean in the world.
(ii) Humans have 46 chromosomes.
(iii) The speed of light in a vacuum is approximately 300,000 km/s.
(iv) Marie Curie won Nobel Prizes in both Physics and Chemistry.
(v) The Mona Lisa was painted by Vincent van Gogh.
a)
(i), (ii) and (iv) only
b)
(ii), (iii) and (iv) only
c)
(iii) and (iv) only
d)
(ii), (iii), (iv) and (v) only
 | Trisha Vashisht answered |
Statements (ii), (iii), and (iv) are correct. Humans have 46 chromosomes, the speed of light in a vacuum is approximately 300,000 km/s, and Marie Curie won Nobel Prizes in both Physics and Chemistry. The Pacific Ocean is the deepest ocean, but the Mona Lisa was painted by Leonardo da Vinci, not Vincent van Gogh.
Which of the following statement(s) is/are correct?
(i) The Nobel Prize was established by Alfred Nobel.
(ii) The Taj Mahal is located in New Delhi.
(iii) The largest planet in the solar system is Jupiter.
(iv) Shakespeare wrote "Hamlet."
(v) The chemical symbol for gold is Au.- a)(i), (iii), (iv) and (v) only
- b)(ii), (iii) and (iv) only
- c)(i), (ii) and (iii) only
- d)(i), (iv) and (v) only
Correct answer is option 'A'. Can you explain this answer?
Which of the following statement(s) is/are correct?
(i) The Nobel Prize was established by Alfred Nobel.
(ii) The Taj Mahal is located in New Delhi.
(iii) The largest planet in the solar system is Jupiter.
(iv) Shakespeare wrote "Hamlet."
(v) The chemical symbol for gold is Au.
(i) The Nobel Prize was established by Alfred Nobel.
(ii) The Taj Mahal is located in New Delhi.
(iii) The largest planet in the solar system is Jupiter.
(iv) Shakespeare wrote "Hamlet."
(v) The chemical symbol for gold is Au.
a)
(i), (iii), (iv) and (v) only
b)
(ii), (iii) and (iv) only
c)
(i), (ii) and (iii) only
d)
(i), (iv) and (v) only
 | C K Academy answered |
Statements (i), (iii), (iv), and (v) are correct. The Nobel Prize was established by Alfred Nobel, Jupiter is the largest planet, Shakespeare wrote "Hamlet," and the chemical symbol for gold is Au. The Taj Mahal is located in Agra, not New Delhi.
Observe the data of populations (in millions) of 10 cities as follows: 10, 20, 15, 30, 25, 35, 40, 50, 45, 55
Find:
(i) Mean of the data
(ii) Mode of the data
(iii) Range of the data- a)(i) - 32.5 million, (ii) - 30 million, (iii) - 45 million
- b)(i) - 32 million, (ii) - 35 million, (iii) - 40 million
- c)(i) - 32.5 million, (ii) - None, (iii) - 45 million
- d)(i) - 31 million, (ii) - 40 million, (iii) - 40 million
Correct answer is option 'C'. Can you explain this answer?
Find:
(i) Mean of the data
(ii) Mode of the data
(iii) Range of the data
a)
(i) - 32.5 million, (ii) - 30 million, (iii) - 45 million
b)
(i) - 32 million, (ii) - 35 million, (iii) - 40 million
c)
(i) - 32.5 million, (ii) - None, (iii) - 45 million
d)
(i) - 31 million, (ii) - 40 million, (iii) - 40 million
| | EduRev Class 8 answered |
The mean of the data is 32.5 million. There is no mode as no number repeats. The range of the data is 45 million (55-10).
Which of the following statement(s) is/are correct?
(i) Mercury is the closest planet to the Sun.
(ii) Venus is known as the Morning Star.
(iii) Jupiter is the largest planet in our solar system.
(iv) Saturn has the most extensive ring system.
(v) Neptune is the furthest planet from the Sun.- a)(i), (ii), and (iii) only
- b)(ii) and (iv) only
- c)(i), (ii), (iii), and (iv) only
- d)(i), (ii), (iii), (iv), and (v)
Correct answer is option 'D'. Can you explain this answer?
(i) Mercury is the closest planet to the Sun.
(ii) Venus is known as the Morning Star.
(iii) Jupiter is the largest planet in our solar system.
(iv) Saturn has the most extensive ring system.
(v) Neptune is the furthest planet from the Sun.
a)
(i), (ii), and (iii) only
b)
(ii) and (iv) only
c)
(i), (ii), (iii), and (iv) only
d)
(i), (ii), (iii), (iv), and (v)
| | EduRev Class 8 answered |
All the statements are correct. Mercury is closest to the Sun, Venus is known as the Morning Star, Jupiter is the largest planet, Saturn has the most extensive ring system, and Neptune is the furthest planet from the Sun.
Which of the following statement(s) is/are correct?
(i) The human body has four lungs.
(ii) The Atlantic Ocean is the largest ocean on Earth.
(iii) Light travels faster than sound.
(iv) Water boils at 100 degrees Celsius at standard atmospheric pressure.
(v) Venus is the hottest planet in the solar system.- a)(i), (ii) and (iii) only
- b)(ii), (iv) and (v) only
- c)(iii), (iv) and (v) only
- d)(i), (iii) and (v) only
Correct answer is option 'C'. Can you explain this answer?
Which of the following statement(s) is/are correct?
(i) The human body has four lungs.
(ii) The Atlantic Ocean is the largest ocean on Earth.
(iii) Light travels faster than sound.
(iv) Water boils at 100 degrees Celsius at standard atmospheric pressure.
(v) Venus is the hottest planet in the solar system.
(i) The human body has four lungs.
(ii) The Atlantic Ocean is the largest ocean on Earth.
(iii) Light travels faster than sound.
(iv) Water boils at 100 degrees Celsius at standard atmospheric pressure.
(v) Venus is the hottest planet in the solar system.
a)
(i), (ii) and (iii) only
b)
(ii), (iv) and (v) only
c)
(iii), (iv) and (v) only
d)
(i), (iii) and (v) only
| | C K Academy answered |
Statements (iii), (iv), and (v) are correct. Light travels faster than sound, water boils at 100 degrees Celsius at standard atmospheric pressure, and Venus is the hottest planet. Humans have two lungs, and the Pacific Ocean is the largest ocean on Earth.
Read the given statements carefully and select the correct option.
Statement-I: The Statue of Liberty was a gift from France to the United States.
Statement-II: The Statue of Liberty is located in San Francisco.- a)Both Statement-I and Statement-II are true.
- b)Both Statement-I and Statement-II are false.
- c)Statement-I is true but Statement-II is false.
- d)Statement-I is false but Statement-II is true.
Correct answer is option 'C'. Can you explain this answer?
Statement-I: The Statue of Liberty was a gift from France to the United States.
Statement-II: The Statue of Liberty is located in San Francisco.
a)
Both Statement-I and Statement-II are true.
b)
Both Statement-I and Statement-II are false.
c)
Statement-I is true but Statement-II is false.
d)
Statement-I is false but Statement-II is true.
| | EduRev Class 8 answered |
Statement-I is true because the Statue of Liberty was a gift from France to the United States. Statement-II is false because the Statue of Liberty is located in New York City, not San Francisco.
Read the given statements carefully and select the correct option.
Statement-I: The Amazon River is the longest river in the world.
Statement-II: The Amazon Rainforest is known as the "lungs of the Earth."- a)Both Statement-I and Statement-II are true.
- b)Both Statement-I and Statement-II are false.
- c)Statement-I is true but Statement-II is false.
- d)Statement-I is false but Statement-II is true.
Correct answer is option 'D'. Can you explain this answer?
Statement-I: The Amazon River is the longest river in the world.
Statement-II: The Amazon Rainforest is known as the "lungs of the Earth."
a)
Both Statement-I and Statement-II are true.
b)
Both Statement-I and Statement-II are false.
c)
Statement-I is true but Statement-II is false.
d)
Statement-I is false but Statement-II is true.
| | EduRev Class 8 answered |
Statement-I is false because the Nile River is the longest river in the world. Statement-II is true because the Amazon Rainforest is known as the "lungs of the Earth."
Read the given statements carefully and select the correct option.
Statement-I: The Moon is the fifth planet from the Sun.
Statement-II: The Moon is Earth's only natural satellite.- a)Both Statement-I and Statement-II are true.
- b)Both Statement-I and Statement-II are false.
- c)Statement-I is true but Statement-II is false.
- d)Statement-I is false but Statement-II is true.
Correct answer is option 'D'. Can you explain this answer?
Statement-I: The Moon is the fifth planet from the Sun.
Statement-II: The Moon is Earth's only natural satellite.
a)
Both Statement-I and Statement-II are true.
b)
Both Statement-I and Statement-II are false.
c)
Statement-I is true but Statement-II is false.
d)
Statement-I is false but Statement-II is true.
| | EduRev Class 8 answered |
Statement-I is false because the Moon is not a planet and is not located fifth from the Sun; it orbits Earth. Statement-II is true because the Moon is Earth's only natural satellite.
Read the given paragraph.
The Eiffel Tower is a wrought-iron lattice tower on the Champ de Mars in Paris, France. It is named after the engineer (i), whose company designed and built the tower. The tower was constructed as the entrance arch to the (ii). The Eiffel Tower is (iii) meters tall, and it was the tallest man-made structure in the world until the completion of the (iv).- a)Alexandre Gustave Eiffel, 1889 World's Fair, 300, Empire State Building
- b)Alexandre Gustave Eiffel, 1900 World's Fair, 324, Empire State Building
- c)Alexandre Gustave Eiffel, 1889 World's Fair, 324, Empire State Building
- d)Alexandre Gustave Eiffel, 1900 World's Fair, 300, Burj Khalifa
Correct answer is option 'C'. Can you explain this answer?
The Eiffel Tower is a wrought-iron lattice tower on the Champ de Mars in Paris, France. It is named after the engineer (i), whose company designed and built the tower. The tower was constructed as the entrance arch to the (ii). The Eiffel Tower is (iii) meters tall, and it was the tallest man-made structure in the world until the completion of the (iv).
a)
Alexandre Gustave Eiffel, 1889 World's Fair, 300, Empire State Building
b)
Alexandre Gustave Eiffel, 1900 World's Fair, 324, Empire State Building
c)
Alexandre Gustave Eiffel, 1889 World's Fair, 324, Empire State Building
d)
Alexandre Gustave Eiffel, 1900 World's Fair, 300, Burj Khalifa
| | EduRev Class 8 answered |
The Eiffel Tower is named after Alexandre Gustave Eiffel. It was constructed as the entrance arch to the 1889 World's Fair. The Eiffel Tower is 324 meters tall and was the tallest man-made structure until the completion of the Empire State Building.
Read the given paragraph.
The Olympic Games are a leading international sporting event featuring summer and winter sports competitions. The first modern Olympic Games were held in (i). The Olympic symbol consists of (ii) interlocking rings, representing the unity of the five inhabited continents. The most gold medals in a single Olympics were won by (iii), who won (iv) gold medals.- a)1896, five, Michael Phelps, eight
- b)1900, five, Mark Spitz, seven
- c)1896, five, Mark Spitz, seven
- d)1900, five, Michael Phelps, eight
Correct answer is option 'A'. Can you explain this answer?
The Olympic Games are a leading international sporting event featuring summer and winter sports competitions. The first modern Olympic Games were held in (i). The Olympic symbol consists of (ii) interlocking rings, representing the unity of the five inhabited continents. The most gold medals in a single Olympics were won by (iii), who won (iv) gold medals.
a)
1896, five, Michael Phelps, eight
b)
1900, five, Mark Spitz, seven
c)
1896, five, Mark Spitz, seven
d)
1900, five, Michael Phelps, eight
| | C K Academy answered |
The first modern Olympic Games were held in 1896. The Olympic symbol consists of five interlocking rings. Michael Phelps won the most gold medals in a single Olympics, with eight gold medals.
Which of the following statement(s) is/are correct?
(i) The Pacific Ocean is the largest ocean.
(ii) The Atlantic Ocean is the second largest ocean.
(iii) The Indian Ocean is the third largest ocean.
(iv) The Arctic Ocean is the smallest ocean.
(v) The Southern Ocean is larger than the Arctic Ocean.- a)(i), (ii), and (iii) only
- b)(ii), (iii), and (iv) only
- c)(i), (ii), (iii), and (iv) only
- d)(i), (ii), (iii), (iv), and (v)
Correct answer is option 'D'. Can you explain this answer?
Which of the following statement(s) is/are correct?
(i) The Pacific Ocean is the largest ocean.
(ii) The Atlantic Ocean is the second largest ocean.
(iii) The Indian Ocean is the third largest ocean.
(iv) The Arctic Ocean is the smallest ocean.
(v) The Southern Ocean is larger than the Arctic Ocean.
(i) The Pacific Ocean is the largest ocean.
(ii) The Atlantic Ocean is the second largest ocean.
(iii) The Indian Ocean is the third largest ocean.
(iv) The Arctic Ocean is the smallest ocean.
(v) The Southern Ocean is larger than the Arctic Ocean.
a)
(i), (ii), and (iii) only
b)
(ii), (iii), and (iv) only
c)
(i), (ii), (iii), and (iv) only
d)
(i), (ii), (iii), (iv), and (v)
| | EduRev Class 8 answered |
All the statements are correct. The Pacific is the largest ocean, followed by the Atlantic, then the Indian, the Arctic is the smallest, and the Southern Ocean is larger than the Arctic Ocean.
Which of the following statement(s) is/are correct?
(i) The capital of Canada is Toronto.
(ii) The currency of Japan is Yen.
(iii) The official language of Brazil is Portuguese.
(iv) The Eiffel Tower is located in London.
(v) The Great Barrier Reef is in Australia.- a)(ii), (iii), and (v) only
- b)(i), (ii), and (iv) only
- c)(ii) and (iii) only
- d)(ii), (iii), and (iv) only
Correct answer is option 'A'. Can you explain this answer?
(i) The capital of Canada is Toronto.
(ii) The currency of Japan is Yen.
(iii) The official language of Brazil is Portuguese.
(iv) The Eiffel Tower is located in London.
(v) The Great Barrier Reef is in Australia.
a)
(ii), (iii), and (v) only
b)
(i), (ii), and (iv) only
c)
(ii) and (iii) only
d)
(ii), (iii), and (iv) only
| | EduRev Class 8 answered |
The capital of Canada is Ottawa, not Toronto. The Eiffel Tower is located in Paris, not London. The currency of Japan is Yen, the official language of Brazil is Portuguese, and the Great Barrier Reef is in Australia.
Observe the data of temperatures (in °C) of a city over 7 days as follows: 30, 32, 31, 33, 32, 31, 30
Find:
(i) Mean of the data
(ii) Mode of the data
(iii) Range of the data- a)(i) - 31.3°C, (ii) - 31°C, (iii) - 3°C
- b)(i) - 31.5°C, (ii) - 32°C, (iii) - 3°C
- c)(i) - 31.3°C, (ii) - 30°C, (iii) - 4°C
- d)(i) - 31.4°C, (ii) - 32°C, (iii) - 3°C
Correct answer is option 'A'. Can you explain this answer?
Find:
(i) Mean of the data
(ii) Mode of the data
(iii) Range of the data
a)
(i) - 31.3°C, (ii) - 31°C, (iii) - 3°C
b)
(i) - 31.5°C, (ii) - 32°C, (iii) - 3°C
c)
(i) - 31.3°C, (ii) - 30°C, (iii) - 4°C
d)
(i) - 31.4°C, (ii) - 32°C, (iii) - 3°C
| | EduRev Class 8 answered |
The mean of the data is 31.3°C. The mode is 31°C, which appears most frequently. The range is 3°C (33-30).
Match the columns and select the correct option from the given codes.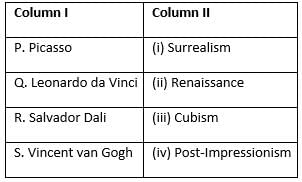
- a)P-(iii), Q-(ii), R-(i), S-(iv)
- b)P-(ii), Q-(i), R-(iii), S-(iv)
- c)P-(iii), Q-(iv), R-(ii), S-(i)
- d)P-(i), Q-(iii), R-(iv), S-(ii)
Correct answer is option 'A'. Can you explain this answer?
Match the columns and select the correct option from the given codes.
a)
P-(iii), Q-(ii), R-(i), S-(iv)
b)
P-(ii), Q-(i), R-(iii), S-(iv)
c)
P-(iii), Q-(iv), R-(ii), S-(i)
d)
P-(i), Q-(iii), R-(iv), S-(ii)
| | EduRev Class 8 answered |
Picasso is associated with Cubism, Leonardo da Vinci with the Renaissance, Salvador Dali with Surrealism, and Vincent van Gogh with Post-Impressionism.
Which of the following statement(s) is/are correct?
(i) The Taj Mahal is located in India.
(ii) The Statue of Liberty was a gift from France to the USA.
(iii) The Colosseum is in Rome, Italy.
(iv) The Great Pyramids are in Egypt.
(v) The Leaning Tower of Pisa is in Spain.- a)(i), (ii), (iii), and (iv) only
- b)(ii), (iii), and (iv) only
- c)(i), (ii), (iv), and (v) only
- d)(i), (ii), (iii), (iv), and (v)
Correct answer is option 'A'. Can you explain this answer?
Which of the following statement(s) is/are correct?
(i) The Taj Mahal is located in India.
(ii) The Statue of Liberty was a gift from France to the USA.
(iii) The Colosseum is in Rome, Italy.
(iv) The Great Pyramids are in Egypt.
(v) The Leaning Tower of Pisa is in Spain.
(i) The Taj Mahal is located in India.
(ii) The Statue of Liberty was a gift from France to the USA.
(iii) The Colosseum is in Rome, Italy.
(iv) The Great Pyramids are in Egypt.
(v) The Leaning Tower of Pisa is in Spain.
a)
(i), (ii), (iii), and (iv) only
b)
(ii), (iii), and (iv) only
c)
(i), (ii), (iv), and (v) only
d)
(i), (ii), (iii), (iv), and (v)
| | EduRev Class 8 answered |
The Taj Mahal is in India, the Statue of Liberty was a gift from France to the USA, the Colosseum is in Rome, and the Great Pyramids are in Egypt. The Leaning Tower of Pisa is in Italy, not Spain.
Which of the following statement(s) is/are correct?
(i) The Amazon River is the longest river in the world.
(ii) The Great Wall of China is visible from space.
(iii) The Sahara Desert is the largest hot desert in the world.
(iv) Mount Everest is the highest peak in the world.
(v) Australia is the smallest continent.- a)(i), (ii), and (iii) only
- b)(iii) and (iv) only
- c)(iii), (iv), and (v) only
- d)(ii), (iii), and (v) only
Correct answer is option 'C'. Can you explain this answer?
(i) The Amazon River is the longest river in the world.
(ii) The Great Wall of China is visible from space.
(iii) The Sahara Desert is the largest hot desert in the world.
(iv) Mount Everest is the highest peak in the world.
(v) Australia is the smallest continent.
a)
(i), (ii), and (iii) only
b)
(iii) and (iv) only
c)
(iii), (iv), and (v) only
d)
(ii), (iii), and (v) only
| | EduRev Class 8 answered |
The Amazon River is not the longest river; the Nile is. The Great Wall of China is not visible from space with the naked eye. The Sahara Desert is the largest hot desert, Mount Everest is the highest peak, and Australia is the smallest continent.
Read the given statements carefully and select the correct option.
Statement-I: The Pacific Ocean is the largest ocean on Earth.
Statement-II: The Pacific Ocean is located between Africa and Europe.- a)Both Statement-I and Statement-II are true.
- b)Both Statement-I and Statement-II are false.
- c)Statement-I is true but Statement-II is false.
- d)Statement-I is false but Statement-II is true.
Correct answer is option 'C'. Can you explain this answer?
Statement-I: The Pacific Ocean is the largest ocean on Earth.
Statement-II: The Pacific Ocean is located between Africa and Europe.
a)
Both Statement-I and Statement-II are true.
b)
Both Statement-I and Statement-II are false.
c)
Statement-I is true but Statement-II is false.
d)
Statement-I is false but Statement-II is true.
| | EduRev Class 8 answered |
Statement-I is true because the Pacific Ocean is the largest ocean on Earth. Statement-II is false because the Pacific Ocean is located between Asia and the Americas, not Africa and Europe.
Which of the following statement(s) is/are correct?
(i) Thomas Edison invented the light bulb.
(ii) Alexander Graham Bell invented the telephone.
(iii) The Wright brothers invented the airplane.
(iv) Nikola Tesla invented the alternating current (AC).
(v) Albert Einstein developed the theory of relativity.- a)(i), (ii), and (iii) only
- b)(ii), (iii), and (iv) only
- c)(i), (ii), (iii), and (v) only
- d)(i), (ii), (iii), (iv), and (v)
Correct answer is option 'D'. Can you explain this answer?
(i) Thomas Edison invented the light bulb.
(ii) Alexander Graham Bell invented the telephone.
(iii) The Wright brothers invented the airplane.
(iv) Nikola Tesla invented the alternating current (AC).
(v) Albert Einstein developed the theory of relativity.
a)
(i), (ii), and (iii) only
b)
(ii), (iii), and (iv) only
c)
(i), (ii), (iii), and (v) only
d)
(i), (ii), (iii), (iv), and (v)
| | C K Academy answered |
All the statements are correct. Thomas Edison invented the light bulb, Alexander Graham Bell invented the telephone, the Wright brothers invented the airplane, Nikola Tesla invented AC, and Albert Einstein developed the theory of relativity.
Which of the following statement(s) is/are correct?
(i) The Olympics are held every four years.
(ii) The first modern Olympic Games were held in Athens in 1896.
(iii) The Winter Olympics are held in the same year as the Summer Olympics.
(iv) The Olympic symbol consists of five interlocking rings.
(v) The next Summer Olympics will be held in Paris in 2024.- a)(i), (ii), (iv), and (v) only
- b)(ii), (iii), and (iv) only
- c)(i), (ii), and (v) only
- d)(i), (ii), (iii), (iv), and (v)
Correct answer is option 'A'. Can you explain this answer?
Which of the following statement(s) is/are correct?
(i) The Olympics are held every four years.
(ii) The first modern Olympic Games were held in Athens in 1896.
(iii) The Winter Olympics are held in the same year as the Summer Olympics.
(iv) The Olympic symbol consists of five interlocking rings.
(v) The next Summer Olympics will be held in Paris in 2024.
a)
(i), (ii), (iv), and (v) only
b)
(ii), (iii), and (iv) only
c)
(i), (ii), and (v) only
d)
(i), (ii), (iii), (iv), and (v)
| | EduRev Class 8 answered |
The Olympics are held every four years, the first modern Olympic Games were held in Athens in 1896, the Olympic symbol consists of five interlocking rings, and the next Summer Olympics will be held in Paris in 2024. The Winter Olympics are held two years after the Summer Olympics.
Match the columns and select the correct option from the given codes.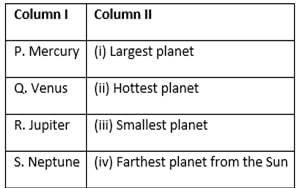
- a)P-(ii), Q-(iii), R-(i), S-(iv)
- b)P-(iii), Q-(ii), R-(i), S-(iv)
- c)P-(iv), Q-(ii), R-(iii), S-(i)
- d)P-(iii), Q-(i), R-(ii), S-(iv)
Correct answer is option 'B'. Can you explain this answer?
Match the columns and select the correct option from the given codes.
a)
P-(ii), Q-(iii), R-(i), S-(iv)
b)
P-(iii), Q-(ii), R-(i), S-(iv)
c)
P-(iv), Q-(ii), R-(iii), S-(i)
d)
P-(iii), Q-(i), R-(ii), S-(iv)
| | EduRev Class 8 answered |
Mercury is the smallest planet, Venus is the hottest planet, Jupiter is the largest planet, and Neptune is the farthest planet from the Sun.
Match the columns and select the correct option from the given codes.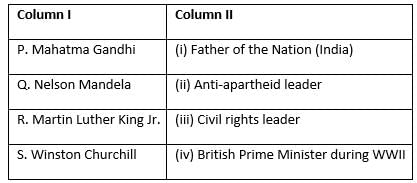
- a)P-(iii), Q-(ii), R-(i), S-(iv)
- b)P-(ii), Q-(iv), R-(iii), S-(i)
- c)P-(i), Q-(ii), R-(iii), S-(iv)
- d)P-(i), Q-(iii), R-(ii), S-(iv)
Correct answer is option 'C'. Can you explain this answer?
Match the columns and select the correct option from the given codes.
a)
P-(iii), Q-(ii), R-(i), S-(iv)
b)
P-(ii), Q-(iv), R-(iii), S-(i)
c)
P-(i), Q-(ii), R-(iii), S-(iv)
d)
P-(i), Q-(iii), R-(ii), S-(iv)
| | Trisha Vashisht answered |
Mahatma Gandhi is known as the Father of the Nation in India, Nelson Mandela was an anti-apartheid leader, Martin Luther King Jr. was a civil rights leader, and Winston Churchill was the British Prime Minister during WWII.
Match the columns and select the correct option from the given codes.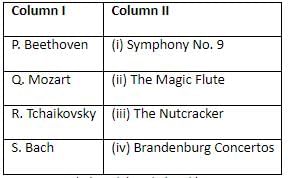
- a)P-(iii), Q-(ii), R-(iv), S-(i)
- b)P-(ii), Q-(iii), R-(i), S-(iv)
- c)P-(i), Q-(ii), R-(iii), S-(iv)
- d)P-(i), Q-(iv), R-(ii), S-(iii)
Correct answer is option 'C'. Can you explain this answer?
Match the columns and select the correct option from the given codes.
a)
P-(iii), Q-(ii), R-(iv), S-(i)
b)
P-(ii), Q-(iii), R-(i), S-(iv)
c)
P-(i), Q-(ii), R-(iii), S-(iv)
d)
P-(i), Q-(iv), R-(ii), S-(iii)
| | EduRev Class 8 answered |
Beethoven is known for Symphony No. 9, Mozart for The Magic Flute, Tchaikovsky for The Nutcracker, and Bach for the Brandenburg Concertos.
Which of the following statement(s) is/are correct?
(i) The first President of the United States was George Washington.
(ii) The longest bone in the human body is the femur.
(iii) The capital of Italy is Rome.
(iv) Mercury is the closest planet to the sun.
(v) The Great Barrier Reef is the largest coral reef system in the world.- a)(i), (ii), (iii) and (v) only
- b)(ii), (iii) and (iv) only
- c)(i), (iii) and (v) only
- d)(i), (ii), (iii), (iv) and (v)
Correct answer is option 'D'. Can you explain this answer?
(i) The first President of the United States was George Washington.
(ii) The longest bone in the human body is the femur.
(iii) The capital of Italy is Rome.
(iv) Mercury is the closest planet to the sun.
(v) The Great Barrier Reef is the largest coral reef system in the world.
a)
(i), (ii), (iii) and (v) only
b)
(ii), (iii) and (iv) only
c)
(i), (iii) and (v) only
d)
(i), (ii), (iii), (iv) and (v)
| | EduRev Class 8 answered |
All the statements are correct. George Washington was the first President, the femur is the longest bone, the capital of Italy is Rome, Mercury is closest to the sun, and the Great Barrier Reef is the largest coral reef system.
Match the columns and select the correct option from the given codes.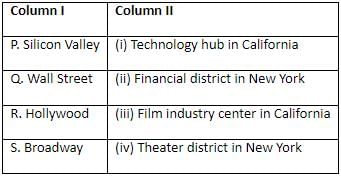
- a)P-(ii), Q-(iii), R-(iv), S-(i)
- b)P-(i), Q-(ii), R-(iii), S-(iv)
- c)P-(iii), Q-(iv), R-(ii), S-(i)
- d)P-(iv), Q-(ii), R-(iii), S-(i)
Correct answer is option 'B'. Can you explain this answer?
Match the columns and select the correct option from the given codes.
a)
P-(ii), Q-(iii), R-(iv), S-(i)
b)
P-(i), Q-(ii), R-(iii), S-(iv)
c)
P-(iii), Q-(iv), R-(ii), S-(i)
d)
P-(iv), Q-(ii), R-(iii), S-(i)
| | Trisha Vashisht answered |
Silicon Valley is the technology hub in California, Wall Street is the financial district in New York, Hollywood is the film industry center in California, and Broadway is the theater district in New York.
Which of the following statement(s) is/are correct?
(i) The human body has 206 bones.
(ii) The largest organ in the human body is the skin.
(iii) The smallest bone in the human body is the stapes in the ear.
(iv) The human heart has four chambers.
(v) The human brain weighs about 3 pounds.- a)(i), (ii), and (iii) only
- b)(ii), (iii), and (iv) only
- c)(i), (ii), (iii), and (iv) only
- d)(i), (ii), (iii), (iv), and (v)
Correct answer is option 'D'. Can you explain this answer?
Which of the following statement(s) is/are correct?
(i) The human body has 206 bones.
(ii) The largest organ in the human body is the skin.
(iii) The smallest bone in the human body is the stapes in the ear.
(iv) The human heart has four chambers.
(v) The human brain weighs about 3 pounds.
(i) The human body has 206 bones.
(ii) The largest organ in the human body is the skin.
(iii) The smallest bone in the human body is the stapes in the ear.
(iv) The human heart has four chambers.
(v) The human brain weighs about 3 pounds.
a)
(i), (ii), and (iii) only
b)
(ii), (iii), and (iv) only
c)
(i), (ii), (iii), and (iv) only
d)
(i), (ii), (iii), (iv), and (v)
| | EduRev Class 8 answered |
All the statements are correct. The human body has 206 bones, the skin is the largest organ, the stapes in the ear is the smallest bone, the heart has four chambers, and the brain weighs about 3 pounds.
Match the columns and select the correct option from the given codes.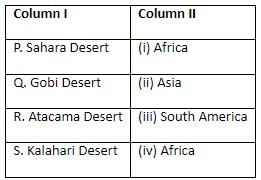
- a)P-(iv), Q-(ii), R-(i), S-(iii)
- b)P-(i), Q-(ii), R-(iii), S-(iv)
- c)P-(iii), Q-(iv), R-(ii), S-(i)
- d)P-(ii), Q-(iii), R-(i), S-(iv)
Correct answer is option 'B'. Can you explain this answer?
Match the columns and select the correct option from the given codes.
a)
P-(iv), Q-(ii), R-(i), S-(iii)
b)
P-(i), Q-(ii), R-(iii), S-(iv)
c)
P-(iii), Q-(iv), R-(ii), S-(i)
d)
P-(ii), Q-(iii), R-(i), S-(iv)
| | Trisha Vashisht answered |
The Sahara Desert is in Africa, the Gobi Desert is in Asia, the Atacama Desert is in South America, and the Kalahari Desert is in Africa.
Read the given statements carefully and select the correct option.
Statement-I: The capital city of Japan is Tokyo.
Statement-II: Tokyo is known for the Eiffel Tower.- a)Both Statement-I and Statement-II are true.
- b)Both Statement-I and Statement-II are false.
- c)Statement-I is true but Statement-II is false.
- d)Statement-I is false but Statement-II is true.
Correct answer is option 'C'. Can you explain this answer?
Statement-I: The capital city of Japan is Tokyo.
Statement-II: Tokyo is known for the Eiffel Tower.
a)
Both Statement-I and Statement-II are true.
b)
Both Statement-I and Statement-II are false.
c)
Statement-I is true but Statement-II is false.
d)
Statement-I is false but Statement-II is true.
| | EduRev Class 8 answered |
Statement-I is true because the capital city of Japan is Tokyo. Statement-II is false because the Eiffel Tower is located in Paris, not Tokyo.
Which of the following statement(s) is/are correct?
(i) The Amazon River is the longest river in the world.
(ii) The capital city of Japan is Tokyo.
(iii) The human brain is made up of approximately 75% water.
(iv) The smallest bone in the human body is located in the ear.
(v) The blue whale is the largest animal on Earth.- a)(i), (ii) and (iv) only
- b)(ii), (iii), (iv) and (v) only
- c)(ii), (iv) and (v) only
- d)(iii), (iv) and (v) only
Correct answer is option 'B'. Can you explain this answer?
(i) The Amazon River is the longest river in the world.
(ii) The capital city of Japan is Tokyo.
(iii) The human brain is made up of approximately 75% water.
(iv) The smallest bone in the human body is located in the ear.
(v) The blue whale is the largest animal on Earth.
a)
(i), (ii) and (iv) only
b)
(ii), (iii), (iv) and (v) only
c)
(ii), (iv) and (v) only
d)
(iii), (iv) and (v) only
| | C K Academy answered |
Statements (ii), (iii), (iv), and (v) are correct. The capital of Japan is Tokyo, the human brain is approximately 75% water, the smallest bone is in the ear, and the blue whale is the largest animal. The Nile, not the Amazon, is the longest river in the world.
Which of the following statement(s) is/are correct?
(i) The Hubble Space Telescope was launched in 1990.
(ii) The chemical formula for water is H₂O.
(iii) The Leaning Tower of Pisa is located in France.
(iv) The Great Wall of China stretches over 13,000 miles.
(v) The light bulb was invented by Alexander Graham Bell.- a)(i), (ii) and (iv) only
- b)(ii), (iii) and (iv) only
- c)(i), (ii) and (v) only
- d)(i), (iii), (iv) and (v) only
Correct answer is option 'A'. Can you explain this answer?
(i) The Hubble Space Telescope was launched in 1990.
(ii) The chemical formula for water is H₂O.
(iii) The Leaning Tower of Pisa is located in France.
(iv) The Great Wall of China stretches over 13,000 miles.
(v) The light bulb was invented by Alexander Graham Bell.
a)
(i), (ii) and (iv) only
b)
(ii), (iii) and (iv) only
c)
(i), (ii) and (v) only
d)
(i), (iii), (iv) and (v) only
| | C K Academy answered |
Statements (i), (ii), and (iv) are correct. The Hubble Space Telescope was launched in 1990, water's chemical formula is H₂O, and the Great Wall of China is over 13,000 miles long. The Leaning Tower of Pisa is in Italy, and the light bulb was invented by Thomas Edison, not Alexander Graham Bell.
Read the given paragraph.
The Great Wall of China is a series of fortifications made of various materials, generally built along an east-to-west line across the northern borders of China. It was built to protect the Chinese states and empires against the raids and invasions of the (i). The total length of all the sections of the Great Wall built over time is estimated to be around (ii) kilometers. The most well-preserved section was built during the (iii) Dynasty. It is often mistakenly believed to be visible from (iv).- a)Mongols, 21,196, Ming, the Moon
- b)Mongols, 13,170, Qing, the Moon
- c)Huns, 21,196, Ming, Space
- d)Huns, 13,170, Qing, Space
Correct answer is option 'A'. Can you explain this answer?
The Great Wall of China is a series of fortifications made of various materials, generally built along an east-to-west line across the northern borders of China. It was built to protect the Chinese states and empires against the raids and invasions of the (i). The total length of all the sections of the Great Wall built over time is estimated to be around (ii) kilometers. The most well-preserved section was built during the (iii) Dynasty. It is often mistakenly believed to be visible from (iv).
a)
Mongols, 21,196, Ming, the Moon
b)
Mongols, 13,170, Qing, the Moon
c)
Huns, 21,196, Ming, Space
d)
Huns, 13,170, Qing, Space
| | Trisha Vashisht answered |
The Great Wall of China was built to protect against the Mongols. The total length is estimated to be around 21,196 kilometers. The most well-preserved section was built during the Ming Dynasty. It is often mistakenly believed to be visible from the Moon.
Which of the following statement(s) is/are correct?
(i) The Great Pyramid of Giza is one of the Seven Wonders of the Ancient World.
(ii) Albert Einstein developed the theory of relativity.
(iii) The first person to walk on the moon was Neil Armstrong.
(iv) The capital of Canada is Ottawa.
(v) The Earth revolves around the sun once every 365 days.- a)(i), (ii), (iii) and (iv) only
- b)(ii), (iii) and (v) only
- c)(i), (iii), (iv) and (v) only
- d)(i), (ii), (iii), (iv) and (v)
Correct answer is option 'D'. Can you explain this answer?
(i) The Great Pyramid of Giza is one of the Seven Wonders of the Ancient World.
(ii) Albert Einstein developed the theory of relativity.
(iii) The first person to walk on the moon was Neil Armstrong.
(iv) The capital of Canada is Ottawa.
(v) The Earth revolves around the sun once every 365 days.
a)
(i), (ii), (iii) and (iv) only
b)
(ii), (iii) and (v) only
c)
(i), (iii), (iv) and (v) only
d)
(i), (ii), (iii), (iv) and (v)
| | C K Academy answered |
All the statements are correct. The Great Pyramid of Giza is one of the Seven Wonders, Einstein developed the theory of relativity, Neil Armstrong was the first person on the moon, Ottawa is the capital of Canada, and the Earth revolves around the sun once every 365 days.
Which of the following statement(s) is/are correct?
(i) The capital of Australia is Sydney.
(ii) The Eiffel Tower is located in Berlin, Germany.
(iii) The currency of Japan is the Yen.
(iv) The Statue of Liberty was a gift from France to the United States.
(v) The Great Barrier Reef is off the coast of Queensland, Australia.- a)(iii), (iv) and (v) only
- b)(ii) and (iv) only
- c)(i), (iii) and (v) only
- d)(iii) and (v) only
Correct answer is option 'A'. Can you explain this answer?
Which of the following statement(s) is/are correct?
(i) The capital of Australia is Sydney.
(ii) The Eiffel Tower is located in Berlin, Germany.
(iii) The currency of Japan is the Yen.
(iv) The Statue of Liberty was a gift from France to the United States.
(v) The Great Barrier Reef is off the coast of Queensland, Australia.
(i) The capital of Australia is Sydney.
(ii) The Eiffel Tower is located in Berlin, Germany.
(iii) The currency of Japan is the Yen.
(iv) The Statue of Liberty was a gift from France to the United States.
(v) The Great Barrier Reef is off the coast of Queensland, Australia.
a)
(iii), (iv) and (v) only
b)
(ii) and (iv) only
c)
(i), (iii) and (v) only
d)
(iii) and (v) only
| | C K Academy answered |
Statements (iii), (iv), and (v) are correct. The currency of Japan is the Yen, the Statue of Liberty was a gift from France, and the Great Barrier Reef is located off the coast of Queensland. Canberra is the capital of Australia, not Sydney, and the Eiffel Tower is in Paris, France, not Berlin.
Read the given statements carefully and select the correct option.
Statement-I: The Great Barrier Reef is the largest coral reef system in the world.
Statement-II: The Great Barrier Reef is located off the coast of India.- a)Both Statement-I and Statement-II are true.
- b)Both Statement-I and Statement-II are false.
- c)Statement-I is true but Statement-II is false.
- d)Statement-I is false but Statement-II is true.
Correct answer is option 'C'. Can you explain this answer?
Statement-I: The Great Barrier Reef is the largest coral reef system in the world.
Statement-II: The Great Barrier Reef is located off the coast of India.
a)
Both Statement-I and Statement-II are true.
b)
Both Statement-I and Statement-II are false.
c)
Statement-I is true but Statement-II is false.
d)
Statement-I is false but Statement-II is true.
| | EduRev Class 8 answered |
Statement-I is true because the Great Barrier Reef is the largest coral reef system in the world. Statement-II is false because the Great Barrier Reef is located off the coast of Australia, not India.
Read the given statements carefully and select the correct option.
Statement-I: The Great Wall of China is visible from space.
Statement-II: The Great Wall of China was built to protect against invasions.- a)Both Statement-I and Statement-II are true.
- b)Both Statement-I and Statement-II are false.
- c)Statement-I is true but Statement-II is false.
- d)Statement-I is false but Statement-II is true.
Correct answer is option 'D'. Can you explain this answer?
Statement-I: The Great Wall of China is visible from space.
Statement-II: The Great Wall of China was built to protect against invasions.
a)
Both Statement-I and Statement-II are true.
b)
Both Statement-I and Statement-II are false.
c)
Statement-I is true but Statement-II is false.
d)
Statement-I is false but Statement-II is true.
| | EduRev Class 8 answered |
Statement-I is false because the Great Wall of China is not visible from space with the naked eye. Statement-II is true because it was built to protect against invasions.
Match the columns and select the correct option from the given codes.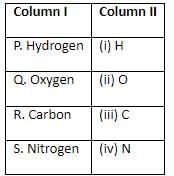
- a)P-(i), Q-(ii), R-(iv), S-(iii)
- b)P-(ii), Q-(i), R-(iii), S-(iv)
- c)P-(i), Q-(ii), R-(iii), S-(iv)
- d)P-(iii), Q-(i), R-(ii), S-(iv)
Correct answer is option 'C'. Can you explain this answer?
Match the columns and select the correct option from the given codes.
a)
P-(i), Q-(ii), R-(iv), S-(iii)
b)
P-(ii), Q-(i), R-(iii), S-(iv)
c)
P-(i), Q-(ii), R-(iii), S-(iv)
d)
P-(iii), Q-(i), R-(ii), S-(iv)
| | EduRev Class 8 answered |
Hydrogen is H, Oxygen is O, Carbon is C, and Nitrogen is N.
Read the given paragraph.
The Nobel Peace Prize is one of the five Nobel Prizes established by the will of Alfred Nobel. The prize is awarded to individuals or organizations who have made significant contributions to world peace. The (i) Nobel Peace Prize was awarded in 1901. (ii) holds the record for the most Nobel Peace Prizes won by an organization, with (iii) prizes. The youngest recipient of the prize is (iv).- a)first, United Nations, three, Malala Yousafzai
- b)second, Red Cross, three, Malala Yousafzai
- c)first, Red Cross, three, Malala Yousafzai
- d)second, United Nations, two, Malala Yousafzai
Correct answer is option 'C'. Can you explain this answer?
The Nobel Peace Prize is one of the five Nobel Prizes established by the will of Alfred Nobel. The prize is awarded to individuals or organizations who have made significant contributions to world peace. The (i) Nobel Peace Prize was awarded in 1901. (ii) holds the record for the most Nobel Peace Prizes won by an organization, with (iii) prizes. The youngest recipient of the prize is (iv).
a)
first, United Nations, three, Malala Yousafzai
b)
second, Red Cross, three, Malala Yousafzai
c)
first, Red Cross, three, Malala Yousafzai
d)
second, United Nations, two, Malala Yousafzai
| | C K Academy answered |
The first Nobel Peace Prize was awarded in 1901. The Red Cross holds the record for the most Nobel Peace Prizes won by an organization, with three prizes. The youngest recipient of the prize is Malala Yousafzai.
Which of the following statement(s) is/are correct?
(i) The Roman numeral for 100 is C.
(ii) The Eiffel Tower was completed in 1889.
(iii) The capital of Brazil is Rio de Janeiro.
(iv) The Earth has three layers: crust, mantle, and core.
(v) The atomic number of oxygen is 8.- a)(i), (ii) and (iii) only
- b)(ii), (iv) and (v) only
- c)(i), (ii), (iv) and (v) only
- d)(iii) and (iv) only
Correct answer is option 'C'. Can you explain this answer?
(i) The Roman numeral for 100 is C.
(ii) The Eiffel Tower was completed in 1889.
(iii) The capital of Brazil is Rio de Janeiro.
(iv) The Earth has three layers: crust, mantle, and core.
(v) The atomic number of oxygen is 8.
a)
(i), (ii) and (iii) only
b)
(ii), (iv) and (v) only
c)
(i), (ii), (iv) and (v) only
d)
(iii) and (iv) only
| | EduRev Class 8 answered |
Statements (i), (ii), (iv), and (v) are correct. The Roman numeral for 100 is C, the Eiffel Tower was completed in 1889, the Earth has three layers, and the atomic number of oxygen is 8. The capital of Brazil is Brasília, not Rio de Janeiro.
Read the given statements carefully and select the correct option.
Statement-I: Mount Everest is the highest mountain in the world.
Statement-II: Mount Everest is located in the Andes mountain range.- a)Both Statement-I and Statement-II are true.
- b)Both Statement-I and Statement-II are false.
- c)Statement-I is true but Statement-II is false.
- d)Statement-I is false but Statement-II is true.
Correct answer is option 'C'. Can you explain this answer?
Statement-I: Mount Everest is the highest mountain in the world.
Statement-II: Mount Everest is located in the Andes mountain range.
a)
Both Statement-I and Statement-II are true.
b)
Both Statement-I and Statement-II are false.
c)
Statement-I is true but Statement-II is false.
d)
Statement-I is false but Statement-II is true.
| | EduRev Class 8 answered |
Statement-I is true because Mount Everest is the highest mountain in the world. Statement-II is false because Mount Everest is located in the Himalayas, not the Andes.
Match the columns and select the correct option from the given codes.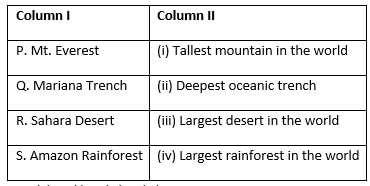
- a)P-(ii), Q-(i), R-(iv), S-(iii)
- b)P-(i), Q-(ii), R-(iii), S-(iv)
- c)P-(iii), Q-(iv), R-(ii), S-(i)
- d)P-(i), Q-(iii), R-(ii), S-(iv)
Correct answer is option 'B'. Can you explain this answer?
Match the columns and select the correct option from the given codes.
a)
P-(ii), Q-(i), R-(iv), S-(iii)
b)
P-(i), Q-(ii), R-(iii), S-(iv)
c)
P-(iii), Q-(iv), R-(ii), S-(i)
d)
P-(i), Q-(iii), R-(ii), S-(iv)
| | Trisha Vashisht answered |
Mt. Everest is the tallest mountain, the Mariana Trench is the deepest oceanic trench, the Sahara Desert is the largest desert, and the Amazon Rainforest is the largest rainforest.
Match the columns and select the correct option from the given codes.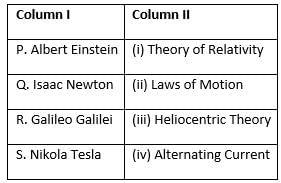
- a)P-(iii), Q-(ii), R-(i), S-(iv)
- b)P-(i), Q-(ii), R-(iii), S-(iv)
- c)P-(ii), Q-(iii), R-(iv), S-(i)
- d)P-(iv), Q-(i), R-(ii), S-(iii)
Correct answer is option 'B'. Can you explain this answer?
Match the columns and select the correct option from the given codes.
a)
P-(iii), Q-(ii), R-(i), S-(iv)
b)
P-(i), Q-(ii), R-(iii), S-(iv)
c)
P-(ii), Q-(iii), R-(iv), S-(i)
d)
P-(iv), Q-(i), R-(ii), S-(iii)
| | Trisha Vashisht answered |
Albert Einstein is known for the Theory of Relativity, Isaac Newton for the Laws of Motion, Galileo Galilei for the Heliocentric Theory, and Nikola Tesla for Alternating Current.
Read the given statements carefully and select the correct option.
Statement-I: The capital of France is Paris.
Statement-II: The Eiffel Tower is located in Berlin.- a)Both Statement-I and Statement-II are true.
- b)Both Statement-I and Statement-II are false.
- c)Statement-I is true but Statement-II is false.
- d)Statement-I is false but Statement-II is true.
Correct answer is option 'C'. Can you explain this answer?
Statement-I: The capital of France is Paris.
Statement-II: The Eiffel Tower is located in Berlin.
a)
Both Statement-I and Statement-II are true.
b)
Both Statement-I and Statement-II are false.
c)
Statement-I is true but Statement-II is false.
d)
Statement-I is false but Statement-II is true.
| | EduRev Class 8 answered |
Statement-I is true because the capital of France is Paris. Statement-II is false because the Eiffel Tower is located in Paris, not Berlin.
Chapter doubts & questions for Achievers Section - GK Olympiad for Class 8 2026 is part of Class 8 exam preparation. The chapters have been prepared according to the Class 8 exam syllabus. The Chapter doubts & questions, notes, tests & MCQs are made for Class 8 2026 Exam. Find important definitions, questions, notes, meanings, examples, exercises, MCQs and online tests here.
Chapter doubts & questions of Achievers Section - GK Olympiad for Class 8 in English & Hindi are available as part of Class 8 exam. Download more important topics, notes, lectures and mock test series for Class 8 Exam by signing up for free.
GK Olympiad for Class 814 videos|14 docs|37 tests |