


All Exams >
Commerce >
Economics Class 11 >
All Questions
All questions of Use of Statistical Tools for Commerce Exam
Direction: In the following questions, a statement of Assertion (A) is followed by a statement of Reason (R). Mark the correct choice as:Assertion (A): For calculating Arithmetic mean, when Cumulative frequencies are given, the frequencies are to be found for the given series or variables.Reason (R): Cumulative frequencies are calculated by adding the frequencies.- a)Both Assertion (A) and Reason (R) are true, and Reason (R) is the correct explanation of the Assertion (A).
- b)Both Assertion (A) and Reason (R) are true, but Reason (R) is not the correct explanation of the Assertion (A).
- c)Assertion (A) is true, but Reason (R) is false.
- d)Assertion (A) is false, but Reason (R) is true.
Correct answer is option 'B'. Can you explain this answer?
Direction: In the following questions, a statement of Assertion (A) is followed by a statement of Reason (R). Mark the correct choice as:
Assertion (A): For calculating Arithmetic mean, when Cumulative frequencies are given, the frequencies are to be found for the given series or variables.
Reason (R): Cumulative frequencies are calculated by adding the frequencies.
a)
Both Assertion (A) and Reason (R) are true, and Reason (R) is the correct explanation of the Assertion (A).
b)
Both Assertion (A) and Reason (R) are true, but Reason (R) is not the correct explanation of the Assertion (A).
c)
Assertion (A) is true, but Reason (R) is false.
d)
Assertion (A) is false, but Reason (R) is true.
|
|
Arun Yadav answered |
The arithmetic mean of the following observation 4, 8, 12, 16, is 10. 3. Cumulative frequency is needed while finding the median of the distribution. In case of calculation of median after arranging the data in ascending or descending order, the cumulative frequencies are calculated.
| 1 Crore+ students have signed up on EduRev. Have you? Download the App |
Expands CSO.- a)Central Statistics Office
- b)Central Statistical organisation
- c)Central Statistics organisation
- d)Central Statistical office
Correct answer is option 'A'. Can you explain this answer?
Expands CSO.
a)
Central Statistics Office
b)
Central Statistical organisation
c)
Central Statistics organisation
d)
Central Statistical office
|
|
Gaurav Kumar answered |
The CSO, Central statistics Office is responsible for conducting statistical activities in the economy.
Identify the correct pair of terms with their formula from the following Columns I and II: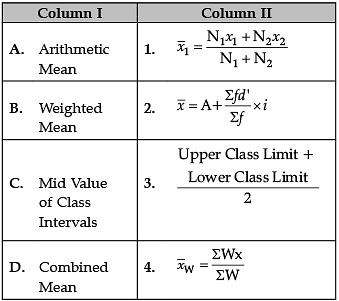
- a)A–1
- b)B–2
- c)C–3
- d)D–4
Correct answer is option 'C'. Can you explain this answer?
Identify the correct pair of terms with their formula from the following Columns I and II:
a)
A–1
b)
B–2
c)
C–3
d)
D–4

|
Notes Wala answered |
Correct Formulas are
A. Arithmetic Mean: 
B. Weighted Mean: 
C. Mid Value of Class Intervals: 
D. Combined Mean: 
Direction: In the following questions, a statement of Assertion (A) is followed by a statement of Reason (R). Mark the correct choice as:Assertion (A): The Index Number shows the change in the relative price from the base year.Reason (R): Index number is calculated as a ratio of current price with the base price.- a)Both Assertion (A) and Reason (R) are true, and Reason (R) is the correct explanation of the Assertion (A).
- b)Both Assertion (A) and Reason (R) are true, but Reason (R) is not the correct explanation of the Assertion (A).
- c)Assertion (A) is true, but Reason (R) is false.
- d)Assertion (A) is false, but Reason (R) is true.
Correct answer is option 'B'. Can you explain this answer?
Direction: In the following questions, a statement of Assertion (A) is followed by a statement of Reason (R). Mark the correct choice as:
Assertion (A): The Index Number shows the change in the relative price from the base year.
Reason (R): Index number is calculated as a ratio of current price with the base price.
a)
Both Assertion (A) and Reason (R) are true, and Reason (R) is the correct explanation of the Assertion (A).
b)
Both Assertion (A) and Reason (R) are true, but Reason (R) is not the correct explanation of the Assertion (A).
c)
Assertion (A) is true, but Reason (R) is false.
d)
Assertion (A) is false, but Reason (R) is true.
|
|
Ishan Choudhury answered |
Index number in statistics is the measurement of change in a variable or variables across a determined period. It will show general relative change and not a directly measurable figure. An index number is expressed in percentage form.
Direction: In the following questions, a statement of Assertion (A) is followed by a statement of Reason (R). Mark the correct choice as:Assertion (A): Scatter Diagram method is a graphic expression of the degree and direction or absence of correlation.Reason (R): Scatter Diagram method fails to produce definite trend.- a)Both Assertion (A) and Reason (R) are true, and Reason (R) is the correct explanation of the Assertion (A).
- b)Both Assertion (A) and Reason (R) are true, but Reason (R) is not the correct explanation of the Assertion (A).
- c)Assertion (A) is true, but Reason (R) is false.
- d)Assertion (A) is false, but Reason (R) is true.
Correct answer is option 'B'. Can you explain this answer?
Direction: In the following questions, a statement of Assertion (A) is followed by a statement of Reason (R). Mark the correct choice as:
Assertion (A): Scatter Diagram method is a graphic expression of the degree and direction or absence of correlation.
Reason (R): Scatter Diagram method fails to produce definite trend.
a)
Both Assertion (A) and Reason (R) are true, and Reason (R) is the correct explanation of the Assertion (A).
b)
Both Assertion (A) and Reason (R) are true, but Reason (R) is not the correct explanation of the Assertion (A).
c)
Assertion (A) is true, but Reason (R) is false.
d)
Assertion (A) is false, but Reason (R) is true.

|
Nandini Chakraborty answered |
Assertion (A) Explained
The Assertion states that the Scatter Diagram method visually represents the degree, direction, or absence of correlation between two variables.
- Graphic Representation: Scatter diagrams plot individual data points on a two-dimensional graph, allowing for the visualization of relationships.
- Degree of Correlation: The closeness of the points to a line indicates the strength of the correlation—whether strong, weak, or nonexistent.
Reason (R) Explained
The Reason claims that the Scatter Diagram method fails to produce a definite trend.
- Trend Identification: While scatter diagrams do not always reveal a clear trend, they can still indicate correlations. A trend line can be fitted to identify patterns.
- Limitations: It is crucial to understand that scatter diagrams may not always provide a clear trend without further statistical analysis.
Correct Option Justification
The correct answer is option 'B' because:
- Both Statements are True: Both Assertion (A) and Reason (R) are accurate in their claims.
- Reason is Not an Explanation: However, Reason (R) does not explain Assertion (A). The scatter diagram can indicate correlations despite not always showing a clear or definite trend.
In summary, while both the assertion and reason are correct, the reason does not clarify or justify the assertion, making option 'B' the correct choice.
The following are the precautions that are to be followed while using secondary data- a)reliability
- b)adequacy
- c)suitability of data
- d)hastily
Correct answer is option 'D'. Can you explain this answer?
The following are the precautions that are to be followed while using secondary data
a)
reliability
b)
adequacy
c)
suitability of data
d)
hastily

|
Rishabh Das answered |
Before using the secondary data the investigator should take the precaution of the reliability, adequacy and suitability of thedata.
Identify the correct pair of items from the following Columns I and II: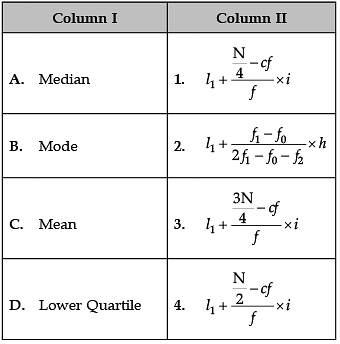
- a)A–1
- b)B–2
- c)C–3
- d)D–4
Correct answer is option 'B'. Can you explain this answer?
Identify the correct pair of items from the following Columns I and II:
a)
A–1
b)
B–2
c)
C–3
d)
D–4
|
|
Amita Das answered |
Correct formulas are:
A. Median: 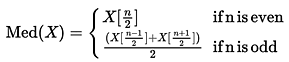
B. Mode: 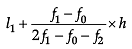
C. Mean: 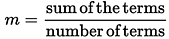
D. Lower Quartile: (N + 1) * 1 / 4
Identify the correct pair of items from the following Columns I and II: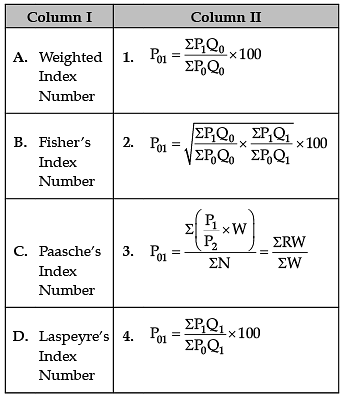
- a)A–1
- b)B–2
- c)C–3
- d)D–4
Correct answer is option 'B'. Can you explain this answer?
Identify the correct pair of items from the following Columns I and II:
a)
A–1
b)
B–2
c)
C–3
d)
D–4
|
|
Anjali Sharma answered |
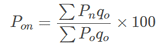
A. Weighted Index Number:
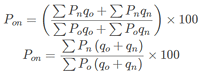
B. Fisher’s Ideal Index Number:
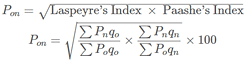
C. Paasche’s Index Number:
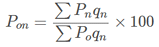
D. Laspeyre’s Index Number:
Direction: In the following questions, a statement of Assertion (A) is followed by a statement of Reason (R). Mark the correct choice as:Assertion (A): Index number and Mean are one and the same thing.Reason (R): Mean is the central value of the items present in the series.- a)Both Assertion (A) and Reason (R) are true, and Reason (R) is the correct explanation of the Assertion (A).
- b)Both Assertion (A) and Reason (R) are true, but Reason (R) is not the correct explanation of the Assertion (A).
- c)Assertion (A) is true, but Reason (R) is false.
- d)Assertion (A) is false, but Reason (R) is true.
Correct answer is option 'D'. Can you explain this answer?
Direction: In the following questions, a statement of Assertion (A) is followed by a statement of Reason (R). Mark the correct choice as:
Assertion (A): Index number and Mean are one and the same thing.
Reason (R): Mean is the central value of the items present in the series.
a)
Both Assertion (A) and Reason (R) are true, and Reason (R) is the correct explanation of the Assertion (A).
b)
Both Assertion (A) and Reason (R) are true, but Reason (R) is not the correct explanation of the Assertion (A).
c)
Assertion (A) is true, but Reason (R) is false.
d)
Assertion (A) is false, but Reason (R) is true.
|
|
Amita Das answered |
An index number is the measure of change in a variable (or group of variables) over time. Index numbers are one of the most used statistical tools in economics. Index numbers are not directly measurable, but represent general, relative changes. They are typically expressed as percents. Whereas, Mean is the central value of the items present in the series
The positive square root of the mean of squared deviations from mean is called- a)central tendancy.
- b)quartile deviation.
- c)mean deviation.
- d)standard deviation.
Correct answer is option 'D'. Can you explain this answer?
The positive square root of the mean of squared deviations from mean is called
a)
central tendancy.
b)
quartile deviation.
c)
mean deviation.
d)
standard deviation.

|
Raman Singh answered |
Standard deviation is calculated through mean only. Positive square root of the variance is the standard deviation.
Direction: In the following questions, a statement of Assertion (A) is followed by a statement of Reason (R). Mark the correct choice as:Assertion (A): Less than or more than ogive can be used to calculate correlation.Reason (R): When changes in two related variables are in the same ratio, then it is a case of perfect correlation.- a)Both Assertion (A) and Reason (R) are true, and Reason (R) is the correct explanation of the Assertion (A).
- b)Both Assertion (A) and Reason (R) are true, but Reason (R) is not the correct explanation of the Assertion (A).
- c)Assertion (A) is true, but Reason (R) is false.
- d)Assertion (A) is false, but Reason (R) is true.
Correct answer is option 'D'. Can you explain this answer?
Direction: In the following questions, a statement of Assertion (A) is followed by a statement of Reason (R). Mark the correct choice as:
Assertion (A): Less than or more than ogive can be used to calculate correlation.
Reason (R): When changes in two related variables are in the same ratio, then it is a case of perfect correlation.
a)
Both Assertion (A) and Reason (R) are true, and Reason (R) is the correct explanation of the Assertion (A).
b)
Both Assertion (A) and Reason (R) are true, but Reason (R) is not the correct explanation of the Assertion (A).
c)
Assertion (A) is true, but Reason (R) is false.
d)
Assertion (A) is false, but Reason (R) is true.
|
|
Priyanka Khatri answered |
If the ratio of change between two variable is not constant i.e. change in one variable leads to a change in another variable but by different amount or when all the points in the scatter diagram tends to lie around a smooth curve.
Decision to collect primary and secondary data depends upon- a)objective of the project.
- b)organisation of data.
- c)source of the project.
- d)analysis of the project.
Correct answer is option 'A'. Can you explain this answer?
Decision to collect primary and secondary data depends upon
a)
objective of the project.
b)
organisation of data.
c)
source of the project.
d)
analysis of the project.
|
|
Gaurav Kumar answered |
The decision to collect primary or secondary data depends upon the objective of the project. Objective of the data also determines the size of data.
Direction: In the following questions, a statement of Assertion (A) is followed by a statement of Reason (R). Mark the correct choice as:Assertion (A): Rahim calculated the value of median to be 16 in the series, 5, 8, 15, 16, 25, 45, 80. He used the formula of odd numbers in this case.Reason (R): Median for odd series is calculated by the formula (n+1/2)th term.- a)Both Assertion (A) and Reason (R) are true, and Reason (R) is the correct explanation of the Assertion (A).
- b)Both Assertion (A) and Reason (R) are true, but Reason (R) is not the correct explanation of the Assertion (A).
- c)Assertion (A) is true, but Reason (R) is false.
- d)Assertion (A) is false, but Reason (R) is true.
Correct answer is option 'B'. Can you explain this answer?
Direction: In the following questions, a statement of Assertion (A) is followed by a statement of Reason (R). Mark the correct choice as:
Assertion (A): Rahim calculated the value of median to be 16 in the series, 5, 8, 15, 16, 25, 45, 80. He used the formula of odd numbers in this case.
Reason (R): Median for odd series is calculated by the formula (n+1/2)th term.
a)
Both Assertion (A) and Reason (R) are true, and Reason (R) is the correct explanation of the Assertion (A).
b)
Both Assertion (A) and Reason (R) are true, but Reason (R) is not the correct explanation of the Assertion (A).
c)
Assertion (A) is true, but Reason (R) is false.
d)
Assertion (A) is false, but Reason (R) is true.
|
|
Ishan Choudhury answered |
We know that the formula for the median if the number of observations in a data set is odd is, Median= [(n + 1) / 2]th where, n = number of odd observations.
Direction: In the following questions, a statement of Assertion (A) is followed by a statement of Reason (R). Mark the correct choice as:Assertion (A): Arithmetic mean is affected by the extreme values.Reason (R): All the values are considered while calculating the mean and so if there are more big values or small values it will affect the calculation of the mean.- a)Both Assertion (A) and Reason (R) are true, and Reason (R) is the correct explanation of the Assertion (A).
- b)Both Assertion (A) and Reason (R) are true, but Reason (R) is not the correct explanation of the Assertion (A).
- c)Assertion (A) is true, but Reason (R) is false.
- d)Assertion (A) is false, but Reason (R) is true.
Correct answer is option 'A'. Can you explain this answer?
Direction: In the following questions, a statement of Assertion (A) is followed by a statement of Reason (R). Mark the correct choice as:
Assertion (A): Arithmetic mean is affected by the extreme values.
Reason (R): All the values are considered while calculating the mean and so if there are more big values or small values it will affect the calculation of the mean.
a)
Both Assertion (A) and Reason (R) are true, and Reason (R) is the correct explanation of the Assertion (A).
b)
Both Assertion (A) and Reason (R) are true, but Reason (R) is not the correct explanation of the Assertion (A).
c)
Assertion (A) is true, but Reason (R) is false.
d)
Assertion (A) is false, but Reason (R) is true.
|
|
Amita Das answered |
Arithmetic mean refers to the average amount in a given group of data. It is defined as the summation of all the observation in the data which is divided by the number of observations in the data. Therefore, mean is affected by the extreme values because it includes all the data in a series.
Direction: In the following questions, a statement of Assertion (A) is followed by a statement of Reason (R). Mark the correct choice as:Assertion (A): Fisher ’s Index Number is considered the most ideal index.Reason (R): Ideal index number is the best way of calculating index number.- a)Both Assertion (A) and Reason (R) are true, and Reason (R) is the correct explanation of the Assertion (A).
- b)Both Assertion (A) and Reason (R) are true, but Reason (R) is not the correct explanation of the Assertion (A).
- c)Assertion (A) is true, but Reason (R) is false.
- d)Assertion (A) is false, but Reason (R) is true.
Correct answer is option 'B'. Can you explain this answer?
Direction: In the following questions, a statement of Assertion (A) is followed by a statement of Reason (R). Mark the correct choice as:
Assertion (A): Fisher ’s Index Number is considered the most ideal index.
Reason (R): Ideal index number is the best way of calculating index number.
a)
Both Assertion (A) and Reason (R) are true, and Reason (R) is the correct explanation of the Assertion (A).
b)
Both Assertion (A) and Reason (R) are true, but Reason (R) is not the correct explanation of the Assertion (A).
c)
Assertion (A) is true, but Reason (R) is false.
d)
Assertion (A) is false, but Reason (R) is true.
|
|
Ishan Choudhury answered |
Fisher's index lies between the other two indexes. It is referred to as an “ideal” index because it correctly predicts the expenditure index and it satisfies both the time reversal test as well as factor reversal test.
Direction: In the following questions, a statement of Assertion (A) is followed by a statement of Reason (R). Mark the correct choice as:Assertion (A): While calculating Median of the series, the terms need to be arranged in either ascending order or descending order.Reason (R): In median, the central term is to be found which divides the series into two equal parts.- a)Both Assertion (A) and Reason (R) are true, and Reason (R) is the correct explanation of the Assertion (A).
- b)Both Assertion (A) and Reason (R) are true, but Reason (R) is not the correct explanation of the Assertion (A).
- c)Assertion (A) is true, but Reason (R) is false.
- d)Assertion (A) is false, but Reason (R) is true.
Correct answer is option 'A'. Can you explain this answer?
Direction: In the following questions, a statement of Assertion (A) is followed by a statement of Reason (R). Mark the correct choice as:
Assertion (A): While calculating Median of the series, the terms need to be arranged in either ascending order or descending order.
Reason (R): In median, the central term is to be found which divides the series into two equal parts.
a)
Both Assertion (A) and Reason (R) are true, and Reason (R) is the correct explanation of the Assertion (A).
b)
Both Assertion (A) and Reason (R) are true, but Reason (R) is not the correct explanation of the Assertion (A).
c)
Assertion (A) is true, but Reason (R) is false.
d)
Assertion (A) is false, but Reason (R) is true.

|
Anuj Choudhury answered |
Assertion (A): While calculating Median of the series, the terms need to be arranged in either ascending order or descending order.
Reason (R): In median, the central term is to be found which divides the series into two equal parts.
Explanation:
To understand why the correct answer is option (A), let's break down the assertion and reason and analyze them individually.
Assertion (A): While calculating Median of the series, the terms need to be arranged in either ascending order or descending order.
The assertion states that while calculating the median of a series, the terms must be arranged in either ascending or descending order. This is true because the median is the middle value of a series. By arranging the terms in order, it becomes easier to identify the middle term.
For example, consider the series: 5, 3, 2, 7, 4, 6, 1
If the terms are arranged in ascending order: 1, 2, 3, 4, 5, 6, 7
The median is the middle term, which in this case is 4.
If the terms are arranged in descending order: 7, 6, 5, 4, 3, 2, 1
Again, the median is the middle term, which is still 4.
In both cases, arranging the terms in order allows us to easily identify the middle term, which is the median.
Reason (R): In median, the central term is to be found which divides the series into two equal parts.
The reason states that the median is the central term that divides the series into two equal parts. This is also true because the median represents the middle value in a series. When the terms are arranged in order, the median will divide the series into two equal parts, with an equal number of terms on either side.
For example, consider the series: 1, 2, 3, 4, 5, 6, 7
The median is the middle term, which is 4. When the series is divided into two equal parts, we have:
1, 2, 3 (left side) and 5, 6, 7 (right side)
Both sides have an equal number of terms, and the median (4) is the central term that divides the series into these two parts.
Therefore, both the assertion and the reason are true, and the reason correctly explains the assertion. The correct answer is option (A).
Reason (R): In median, the central term is to be found which divides the series into two equal parts.
Explanation:
To understand why the correct answer is option (A), let's break down the assertion and reason and analyze them individually.
Assertion (A): While calculating Median of the series, the terms need to be arranged in either ascending order or descending order.
The assertion states that while calculating the median of a series, the terms must be arranged in either ascending or descending order. This is true because the median is the middle value of a series. By arranging the terms in order, it becomes easier to identify the middle term.
For example, consider the series: 5, 3, 2, 7, 4, 6, 1
If the terms are arranged in ascending order: 1, 2, 3, 4, 5, 6, 7
The median is the middle term, which in this case is 4.
If the terms are arranged in descending order: 7, 6, 5, 4, 3, 2, 1
Again, the median is the middle term, which is still 4.
In both cases, arranging the terms in order allows us to easily identify the middle term, which is the median.
Reason (R): In median, the central term is to be found which divides the series into two equal parts.
The reason states that the median is the central term that divides the series into two equal parts. This is also true because the median represents the middle value in a series. When the terms are arranged in order, the median will divide the series into two equal parts, with an equal number of terms on either side.
For example, consider the series: 1, 2, 3, 4, 5, 6, 7
The median is the middle term, which is 4. When the series is divided into two equal parts, we have:
1, 2, 3 (left side) and 5, 6, 7 (right side)
Both sides have an equal number of terms, and the median (4) is the central term that divides the series into these two parts.
Therefore, both the assertion and the reason are true, and the reason correctly explains the assertion. The correct answer is option (A).
Identify the correct pair of items from the following Columns I and II: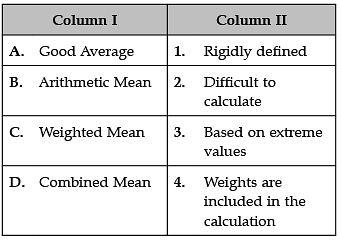
- a)A–1
- b)B–2
- c)C–3
- d)D–4
Correct answer is option 'A'. Can you explain this answer?
Identify the correct pair of items from the following Columns I and II:
a)
A–1
b)
B–2
c)
C–3
d)
D–4
|
|
Anjali Sharma answered |
A. Good Average: Good Average should be based on all the observations:
- Only those averages, where all the data are used give best result, whereas the averages which use less data are not representative of the whole group.
- Good Average should not be unduly affected by extreme value: No term should affect the average too much.
B. Arithmetic Mean: 
A = arithmetic mean
n = number of values
ai = data set values
C. Weighted Mean: Weighted average is a calculation that takes into account the varying degrees of importance of the numbers in a data set. In calculating a weighted average, each number in the data set is multiplied by a predetermined weight before the final calculation is made.
D. Combined Mean: A combined mean is a mean of two or more separate groups, and is found by : Calculating the mean of each group, Combining the results.
Direction: In the following questions, a statement of Assertion (A) is followed by a statement of Reason (R). Mark the correct choice as:Assertion (A): When correlation coefficient (r) is between +0.75 and +1, high degree of positive correlation and when it is between –0.75 to –1 high degree of negative correlation.Reason (R): The value of correlation lies between + 1 and – 1.- a)Both Assertion (A) and Reason (R) are true, and Reason (R) is the correct explanation of the Assertion (A).
- b)Both Assertion (A) and Reason (R) are true, but Reason (R) is not the correct explanation of the Assertion (A).
- c)Assertion (A) is true, but Reason (R) is false.
- d)Assertion (A) is false, but Reason (R) is true.
Correct answer is option 'B'. Can you explain this answer?
Direction: In the following questions, a statement of Assertion (A) is followed by a statement of Reason (R). Mark the correct choice as:
Assertion (A): When correlation coefficient (r) is between +0.75 and +1, high degree of positive correlation and when it is between –0.75 to –1 high degree of negative correlation.
Reason (R): The value of correlation lies between + 1 and – 1.
a)
Both Assertion (A) and Reason (R) are true, and Reason (R) is the correct explanation of the Assertion (A).
b)
Both Assertion (A) and Reason (R) are true, but Reason (R) is not the correct explanation of the Assertion (A).
c)
Assertion (A) is true, but Reason (R) is false.
d)
Assertion (A) is false, but Reason (R) is true.
|
|
Amita Das answered |
A correlation coefficient of +1 indicates a perfect positive correlation. As variable x increases, variable y increases. As variable x decreases, variable y decreases. A correlation coefficient of -1 indicates a perfect negative correlation.
The first step towards making a project is- a)drawing conclusion.
- b)identification of the problem.
- c)collection of data.
- d)presentation of data.
Correct answer is option 'B'. Can you explain this answer?
The first step towards making a project is
a)
drawing conclusion.
b)
identification of the problem.
c)
collection of data.
d)
presentation of data.

|
Sunil Chahar answered |
The first step towards making a project is the identification of the problem. Only after the area of study is identified or the objective is set, the collection and processing of data can be done.
Identify the correct pair of terms and definitions from the following Columns I and II: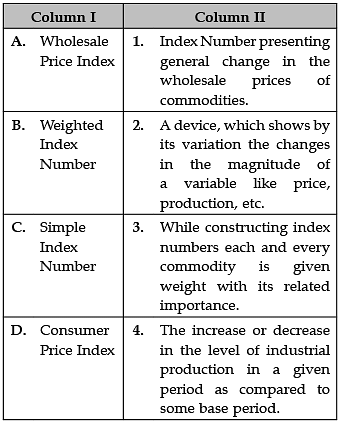
- a)A–1
- b)B–2
- c)C–3
- d)D–4
Correct answer is option 'A'. Can you explain this answer?
Identify the correct pair of terms and definitions from the following Columns I and II:
a)
A–1
b)
B–2
c)
C–3
d)
D–4
|
|
Ishan Choudhury answered |
A. Wholesale Price Index: A wholesale price index (WPI) is an index that measures and tracks the changes in the price of goods in the stages before the retail level. This refers to goods that are sold in bulk and traded between entities or businesses (instead of between consumers).
B. Weighted Index Number: An index number in which the component items are weighted according to some system of weights reflecting their relative importance. It is, however, usual to describe an index as “weighted” only when weighting coefficients enter explicitly into its definition and calculation.
C. Simple Index Number: A simple index number is the ratio of two values representing the same variable, measured in two different situations or in two different periods. For example, a simple index number of price will give the relative variation of the price between the current period and a reference period.
D. Consumer Price Index: The Consumer Price Index (CPI) is a measure of the average change in prices over time in a fixed market basket of goods and services.
Direction: In the following questions, a statement of Assertion (A) is followed by a statement of Reason (R). Mark the correct choice as:Assertion (A): Mode of a series 2, 4, 2, 5, 6, 2, 3, 8, 9, 2, 5, 10 is 2.Reason (R): Mode of a set of observation is that value which occurs the greatest number of times, i.e., with the highest frequency in a series.- a)Both Assertion (A) and Reason (R) are true, and Reason (R) is the correct explanation of the Assertion (A).
- b)Both Assertion (A) and Reason (R) are true, but Reason (R) is not the correct explanation of the Assertion (A).
- c)Assertion (A) is true, but Reason (R) is false.
- d)Assertion (A) is false, but Reason (R) is true.
Correct answer is option 'A'. Can you explain this answer?
Direction: In the following questions, a statement of Assertion (A) is followed by a statement of Reason (R). Mark the correct choice as:
Assertion (A): Mode of a series 2, 4, 2, 5, 6, 2, 3, 8, 9, 2, 5, 10 is 2.
Reason (R): Mode of a set of observation is that value which occurs the greatest number of times, i.e., with the highest frequency in a series.
a)
Both Assertion (A) and Reason (R) are true, and Reason (R) is the correct explanation of the Assertion (A).
b)
Both Assertion (A) and Reason (R) are true, but Reason (R) is not the correct explanation of the Assertion (A).
c)
Assertion (A) is true, but Reason (R) is false.
d)
Assertion (A) is false, but Reason (R) is true.
|
|
Amita Das answered |
The mode of a data set is the number that occurs most frequently in the set. To easily find the mode, put the numbers in order from least to greatest and count how many times each number occurs. The number that occurs the most is the mode.
Direction: In the following questions, a statement of Assertion (A) is followed by a statement of Reason (R). Mark the correct choice as:Assertion (A): Mode is dependent on frequencies.Reason (R): Mode has very less effect of marginal units.- a)Both Assertion (A) and Reason (R) are true, and Reason (R) is the correct explanation of the Assertion (A).
- b)Both Assertion (A) and Reason (R) are true, but Reason (R) is not the correct explanation of the Assertion (A).
- c)Assertion (A) is true, but Reason (R) is false.
- d)Assertion (A) is false, but Reason (R) is true.
Correct answer is option 'B'. Can you explain this answer?
Direction: In the following questions, a statement of Assertion (A) is followed by a statement of Reason (R). Mark the correct choice as:
Assertion (A): Mode is dependent on frequencies.
Reason (R): Mode has very less effect of marginal units.
a)
Both Assertion (A) and Reason (R) are true, and Reason (R) is the correct explanation of the Assertion (A).
b)
Both Assertion (A) and Reason (R) are true, but Reason (R) is not the correct explanation of the Assertion (A).
c)
Assertion (A) is true, but Reason (R) is false.
d)
Assertion (A) is false, but Reason (R) is true.
|
|
Priyanka Khatri answered |
The mode is easy to understand and calculate. The mode is not affected by extreme values. The mode is easy to identify in a data set and in a discrete frequency distribution. The mode is useful for qualitative data. The mode can be computed in an open-ended frequency table.
Identify the correct pair of terms and definitions from the following Columns I and II: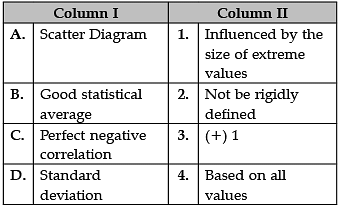
- a)A–1
- b)B–2
- c)C–3
- d)D–4
Correct answer is option 'D'. Can you explain this answer?
Identify the correct pair of terms and definitions from the following Columns I and II:
a)
A–1
b)
B–2
c)
C–3
d)
D–4
|
|
Kiran Mehta answered |
A. Scatter Diagram: Scatter diagram also called scatter plot, X-Y graph. The scatter diagram graphs pairs of numerical data, with one variable on each axis, to look for a relationship between them. If the variables are correlated, the points will fall along a line or curve.
B. Good statistical average: Good Average should be based on all the observations: Only those averages, where all the data are used give best result, whereas the averages which use less data are not representative of the whole group.
C. Perfect negative correlation: A perfect negative correlation means the relationship that exists between two variables is exactly opposite all of the time.
D. Standard deviation: The standard deviation is a measure of the amount of variation or dispersion of a set of values.
While making a project report, collection of data is followed by- a)choice of target group.
- b)organisation of data.
- c)analysis of data.
- d)calculation of data.
Correct answer is option 'B'. Can you explain this answer?
While making a project report, collection of data is followed by
a)
choice of target group.
b)
organisation of data.
c)
analysis of data.
d)
calculation of data.

|
Sushil Ku answered |
While making a project report, collection of data is followed by organisation and presentation of data.
Identify the correct pair of items from the following Columns I and II: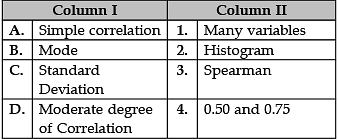
- a)A–1
- b)B–2
- c)C–3
- d)D–4
Correct answer is option 'D'. Can you explain this answer?
Identify the correct pair of items from the following Columns I and II:
a)
A–1
b)
B–2
c)
C–3
d)
D–4
|
|
Arun Yadav answered |
A. Simple Correlation: Simple correlation is a measure used to determine the strength and the direction of the relationship between two variables, X and Y.
B. Mode: The mode is the value that appears most often in a set of data values.
C. Standard Deviation: The standard deviation is a measure of the amount of variation or dispersion of a set of values.
D. Moderate degree of Correlation: In cases (positive or negative), if the value of 'r' is 0.50, it is called moderate correlation. When it lies between 0.50 and 0.75, the degree of correlation is high and when it lies between 0.25 and 0.50, the degree of correlation is low.
Direction: In the following questions, a statement of Assertion (A) is followed by a statement of Reason (R). Mark the correct choice as:Assertion (A): Median is a positional average.Reason (R): Median is the centre most item in a series arranged in either ascending order or descending order.- a)Both Assertion (A) and Reason (R) are true, and Reason (R) is the correct explanation of the Assertion (A).
- b)Both Assertion (A) and Reason (R) are true, but Reason (R) is not the correct explanation of the Assertion (A).
- c)Assertion (A) is true, but Reason (R) is false.
- d)Assertion (A) is false, but Reason (R) is true.
Correct answer is option 'A'. Can you explain this answer?
Direction: In the following questions, a statement of Assertion (A) is followed by a statement of Reason (R). Mark the correct choice as:
Assertion (A): Median is a positional average.
Reason (R): Median is the centre most item in a series arranged in either ascending order or descending order.
a)
Both Assertion (A) and Reason (R) are true, and Reason (R) is the correct explanation of the Assertion (A).
b)
Both Assertion (A) and Reason (R) are true, but Reason (R) is not the correct explanation of the Assertion (A).
c)
Assertion (A) is true, but Reason (R) is false.
d)
Assertion (A) is false, but Reason (R) is true.
|
|
Kiran Mehta answered |
The Median is also known as a positional average. It means that when the data are arranged, median is the middle value if the number of values is odd and the mean of the two middle values, if the numbers of values is even.
Identify the correct pair of items from the following Columns I and II: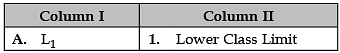
- a)A–1
- b)B–2
- c)C–3
- d)D–4
Correct answer is option 'A'. Can you explain this answer?
Identify the correct pair of items from the following Columns I and II:
a)
A–1
b)
B–2
c)
C–3
d)
D–4
|
|
Amita Das answered |
A. L1: L1 is denoted as Lower Class Limit.
B. Q2: Q2 is denoted as second financial quarter.
C. Q3: Q2 is denoted as The upper or third quartile.
D. Q2: Q2 is denoted as second financial quarter.
Identify the correct pair of terms with their definition from the following Columns I and II: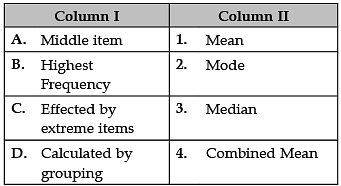
- a)A–1
- b)B–2
- c)C–3
- d)D–4
Correct answer is option 'B'. Can you explain this answer?
Identify the correct pair of terms with their definition from the following Columns I and II:
a)
A–1
b)
B–2
c)
C–3
d)
D–4
|
|
Arun Yadav answered |
A. Mean: The mean formula is given as the average of all the observations. It is expressed as Mean = {Sum of Observation} ÷ {Total numbers of Observations}.
B. Mode: Mode = L + h(fm − f1)(fm − f1) − (fm − f2) L + h(fm − f1)(fm − f1) − (fm − f2), h refers to the size of the class interval.
C. Median: The median formula is {(n + 1) ÷ 2}th, where “n” is the number of items in the set and “th” just means the (n)th number.
D. Combined Mean: A combined mean is a mean of two or more separate groups, and is found by : Calculating the mean of each group, Combining the results.
Data should have clarified nature and specified- a)Source of data
- b)Population
- c)Analysis of data
- d)Objective
Correct answer is option 'D'. Can you explain this answer?
Data should have clarified nature and specified
a)
Source of data
b)
Population
c)
Analysis of data
d)
Objective

|
Bhavana Chauhan answered |
On the basis of this objective, the required data will be collected.
Identify the correct pair of terms and definitions from the following Columns I and II:
- a)A–1
- b)B–2
- c)C–3
- d)D–4
Correct answer is option 'A'. Can you explain this answer?
Identify the correct pair of terms and definitions from the following Columns I and II:
a)
A–1
b)
B–2
c)
C–3
d)
D–4
|
|
Naina Sharma answered |
A. Median: An ogive is a free-hand graph showing the curve of a cumulative distribution function.
B. Mode: The mode is the value that appears most frequently in a data set.
C. Mean: The mean formula is given as the average of all the observations. It is expressed as Mean = {Sum of Observation} ÷ {Total numbers of Observations}.
D. Mean: The mean formula is given as the average of all the observations. It is expressed as Mean = {Sum of Observation} ÷ {Total numbers of Observations}.
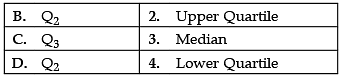
Identify the correct pair of items from the following Columns I and II: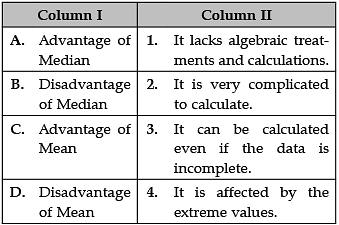
- a)A–1
- b)B–2
- c)C–3
- d)D–4
Correct answer is option 'D'. Can you explain this answer?
Identify the correct pair of items from the following Columns I and II:
a)
A–1
b)
B–2
c)
C–3
d)
D–4
|
|
Kiran Mehta answered |
A. Advantages of Median: The median is not affected by very large or very small values.
B. Disadvantages of Median: Since the median is an average of position, therefore arranging the data in ascending or descending order of magnitude is time-consuming in the case of a large number of observations.
C. Advantage of Mean: Takes account of all values to calculate the average.
D. Disadvantage of Mean: It is affected by the extreme values.
Direction: In the following questions, a statement of Assertion (A) is followed by a statement of Reason (R). Mark the correct choice as:Assertion (A): Mode is affected by the extreme values.Reason (R): In mode, total cannot be obtained.- a)Both Assertion (A) and Reason (R) are true, and Reason (R) is the correct explanation of the Assertion (A).
- b)Both Assertion (A) and Reason (R) are true, but Reason (R) is not the correct explanation of the Assertion (A).
- c)Assertion (A) is true, but Reason (R) is false.
- d)Assertion (A) is false, but Reason (R) is true.
Correct answer is option 'D'. Can you explain this answer?
Direction: In the following questions, a statement of Assertion (A) is followed by a statement of Reason (R). Mark the correct choice as:
Assertion (A): Mode is affected by the extreme values.
Reason (R): In mode, total cannot be obtained.
a)
Both Assertion (A) and Reason (R) are true, and Reason (R) is the correct explanation of the Assertion (A).
b)
Both Assertion (A) and Reason (R) are true, but Reason (R) is not the correct explanation of the Assertion (A).
c)
Assertion (A) is true, but Reason (R) is false.
d)
Assertion (A) is false, but Reason (R) is true.
|
|
Arun Yadav answered |
The mode is not affected by extreme values. The mode is easy to identify in a data set and in a discrete frequency distribution. The mode is useful for qualitative data.
The work which is made on projects is called- a)practical work.
- b)project work.
- c)thesis.
- d)research.
Correct answer is option 'B'. Can you explain this answer?
The work which is made on projects is called
a)
practical work.
b)
project work.
c)
thesis.
d)
research.

|
Jatin Singh answered |
Project work is like a unit in which various types of programmes can be entered to get the desired result.
Bibliography mentions the- a)objective of survey.
- b)target group.
- c)sources of primary data.
- d)sources of secondary data.
Correct answer is option 'D'. Can you explain this answer?
Bibliography mentions the
a)
objective of survey.
b)
target group.
c)
sources of primary data.
d)
sources of secondary data.
|
|
Hardik Handa answered |
Bibliography refers to the mentioning of sources of secondary data. It is stated at the bottom of the report.
Identify the correct pair of terms with their common symbols from the following Columns I and II: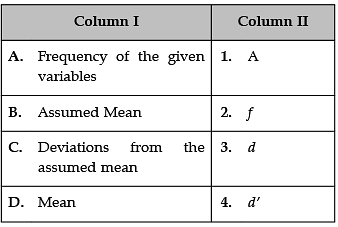
- a)A–1
- b)B–2
- c)C–3
- d)D–4
Correct answer is option 'C'. Can you explain this answer?
Identify the correct pair of terms with their common symbols from the following Columns I and II:
a)
A–1
b)
B–2
c)
C–3
d)
D–4
|
|
Ishan Choudhury answered |
Correct Symbols are
A. Frequency of the given variable: The symbols most often used for frequency are f and the Greek letters nu (ν) and omega (ω).
B. Assumed Mean: Correct symbol of assumed mean is a.
C. Deviations from the assumed mean: Correct symbol of assumed mean is d.
D. Mean: The symbol 'μ' represents the population mean.
Identify the correct pair of terms and definitions from the following Columns I and II: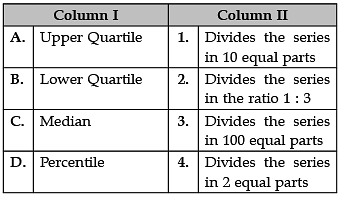
- a)A–1
- b)B–2
- c)C–3
- d)D–4
Correct answer is option 'B'. Can you explain this answer?
Identify the correct pair of terms and definitions from the following Columns I and II:
a)
A–1
b)
B–2
c)
C–3
d)
D–4
|
|
Ishan Choudhury answered |
A. Upper Quartile: The upper quartile (sometimes called Q3) is the number dividing the third and fourth quartile. The upper quartile can also be thought of as the median of the upper half of the numbers. The upper quartile is also called the 75th percentile; it splits the lowest 75% of data from the highest 25%.
B. Lower Quartile: The lower quartile, or first quartile (Q1), is the value under which 25% of data points are found when they are arranged in increasing order. The upper quartile, or third quartile (Q3), is the value under which 75% of data points are found when arranged in increasing order.
C. Median: The median is the middle number in a sorted, ascending or descending, list of numbers and can be more descriptive of that data set than the average. If there is an odd amount of numbers, the median value is the number that is in the middle, with the same amount of numbers below and above.
D. Percentile: A percentile (or a centile) is a measure in statistics. It is a way of expressing where an observation falls in a range of other observations. For example, if a score falls in the 20th percentile, this means that 20 percent of all the scores recorded are lower.
The final stage of the project work is the- a)use of statistical tools.
- b)interpretation and conclusion.
- c)specifying the target group.
- d)specifying the source of data.
Correct answer is option 'B'. Can you explain this answer?
The final stage of the project work is the
a)
use of statistical tools.
b)
interpretation and conclusion.
c)
specifying the target group.
d)
specifying the source of data.
|
|
Jatin Singh answered |
The project should be correctly interpreted with proper conclusions, otherwise the whole object of the investigation would be defeated.
Direction: In the following questions, a statement of Assertion (A) is followed by a statement of Reason (R). Mark the correct choice as:Assertion (A): Combined mean is calculated by multiplying the means with their respective frequencies total and then added and divided by the total number of items.Reason (R): In weighted mean, the weights are assigned to the respective items in the series and then the mean is calculated.- a)Both Assertion (A) and Reason (R) are true, and Reason (R) is the correct explanation of the Assertion (A).
- b)Both Assertion (A) and Reason (R) are true, but Reason (R) is not the correct explanation of the Assertion (A).
- c)Assertion (A) is true, but Reason (R) is false.
- d)Assertion (A) is false, but Reason (R) is true.
Correct answer is option 'B'. Can you explain this answer?
Direction: In the following questions, a statement of Assertion (A) is followed by a statement of Reason (R). Mark the correct choice as:
Assertion (A): Combined mean is calculated by multiplying the means with their respective frequencies total and then added and divided by the total number of items.
Reason (R): In weighted mean, the weights are assigned to the respective items in the series and then the mean is calculated.
a)
Both Assertion (A) and Reason (R) are true, and Reason (R) is the correct explanation of the Assertion (A).
b)
Both Assertion (A) and Reason (R) are true, but Reason (R) is not the correct explanation of the Assertion (A).
c)
Assertion (A) is true, but Reason (R) is false.
d)
Assertion (A) is false, but Reason (R) is true.
|
|
Ishan Choudhury answered |
A combined mean is a mean of two or more separate groups, and is found by : Calculating the mean of each group, Combining the results.
Identify the correct pair of terms with their definition from the following Columns I and II: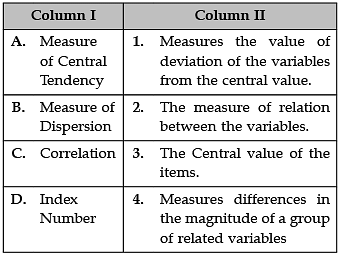
- a)A–1
- b)B–2
- c)C–3
- d)D–4
Correct answer is option 'D'. Can you explain this answer?
Identify the correct pair of terms with their definition from the following Columns I and II:
a)
A–1
b)
B–2
c)
C–3
d)
D–4
|
|
Kiran Mehta answered |
A. Measure of central Tendency: In statistics, a central tendency (or measure of central tendency) is a central or typical value for a probability distribution. It may also be called a center or location of the distribution. The most common measures of central tendency are the arithmetic mean, the median, and the mode.
B. Measure of Dispersion: Measures of dispersion describe the spread of data around a central value (mean, median or mode). There are two measures of dispersion: range (where you subtract the lowest score from the highest score) and standard deviation (SD), which calculates the spread of scores around the mean.
C. Correlation: Correlation is a statistical term describing the degree to which two variables move in coordination with one another. If the two variables move in the same direction, then those variables are said to have a positive correlation. If they move in opposite directions, then they have a negative correlation.
D. Index Number: An index number is the measure of change in a variable (or group of variables) over time. Index numbers are one of the most used statistical tools in economics. Index numbers are not directly measurable, but represent general, relative changes. They are typically expressed as percents.
Identify the correct pair of terms with their formulae from the following Columns I and II: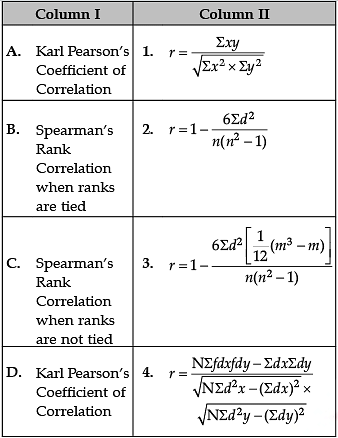
- a)A–1
- b)B–2
- c)C–3
- d)D–4
Correct answer is option 'A'. Can you explain this answer?
Identify the correct pair of terms with their formulae from the following Columns I and II:
a)
A–1
b)
B–2
c)
C–3
d)
D–4
|
|
Kiran Mehta answered |
Correct formulas are
A. Karl Pearson’s Coefficient of Correlation: 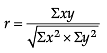
B. Spearman’s Rank Correlation when ranks are tied: 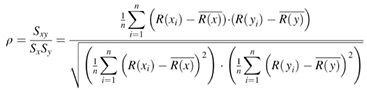
C. Spearman’s Rank Correlation when ranks are not tied: 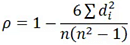
D. Karl Pearson’s Coefficient of Correlation: 
Chapter doubts & questions for Use of Statistical Tools - Economics Class 11 2024 is part of Commerce exam preparation. The chapters have been prepared according to the Commerce exam syllabus. The Chapter doubts & questions, notes, tests & MCQs are made for Commerce 2024 Exam. Find important definitions, questions, notes, meanings, examples, exercises, MCQs and online tests here.
Chapter doubts & questions of Use of Statistical Tools - Economics Class 11 in English & Hindi are available as part of Commerce exam.
Download more important topics, notes, lectures and mock test series for Commerce Exam by signing up for free.
Economics Class 11
75 videos|274 docs|46 tests
|
Signup to see your scores go up within 7 days!
Study with 1000+ FREE Docs, Videos & Tests
10M+ students study on EduRev
|
© EduRev
|
Education Revolution
|


Follow Us
|


Signup to see your scores
go up within 7 days!
Access 1000+ FREE Docs, Videos and Tests
Takes less than 10 seconds to signup