


All Exams >
Commerce >
Economics Class 11 >
All Questions
All questions of CBSE Practice Questions for Commerce Exam
Directions : In the following questions, a statement of Assertion (A) is followed by a statement of Reason (R). Mark the correct choice as:Assertion (A): Data is classified in order to make them simple and brief.Reason (R): It is easy to calculate the result with the help of classification of data in statistics.- a)Both Assertion (A) and Reason (R) are true, and Reason (R) is the correct explanation of Assertion (A).
- b)Both Assertion (A) and Reason (R) are true, but Reason (R) is not the correct explanation of Assertion (A).
- c)Assertion (A) is true, but Reason (R) is false .
- d)Assertion (A) is false, but Reason (R) is true.
Correct answer is option 'B'. Can you explain this answer?
Directions : In the following questions, a statement of Assertion (A) is followed by a statement of Reason (R). Mark the correct choice as:
Assertion (A): Data is classified in order to make them simple and brief.
Reason (R): It is easy to calculate the result with the help of classification of data in statistics.
a)
Both Assertion (A) and Reason (R) are true, and Reason (R) is the correct explanation of Assertion (A).
b)
Both Assertion (A) and Reason (R) are true, but Reason (R) is not the correct explanation of Assertion (A).
c)
Assertion (A) is true, but Reason (R) is false .
d)
Assertion (A) is false, but Reason (R) is true.

|
Uday Chakraborty answered |
Assertion (A): Data is classified in order to make them simple and brief.
Reason (R): It is easy to calculate the result with the help of classification of data in statistics.
The correct answer is option B: Both Assertion (A) and Reason (R) are true, but Reason (R) is not the correct explanation of Assertion (A).
Explanation:
Classification of data is an important step in statistics to organize and simplify large amounts of data. It involves grouping data into categories or classes based on certain characteristics or criteria. This process helps in summarizing the data and presenting it in a more manageable and understandable form.
Reason (R):
While it is true that classification of data can make calculations easier in some cases, it is not the sole purpose of data classification. The primary objective of data classification is to organize and simplify data, making it easier to analyze, interpret, and draw meaningful conclusions. By grouping similar data together, patterns and trends can be identified more effectively.
Example:
For example, consider a dataset of sales data for a company. The data can be classified into different categories such as product type, region, and time period. By organizing the data in this way, it becomes easier to analyze sales trends for different products, compare sales performance across different regions, and track changes over time.
Benefits of Data Classification:
1. Simplifies data: Classification helps in reducing the complexity of data by grouping similar data together. This makes it easier to understand and interpret the information.
2. Enhances analysis: By organizing data into categories, it becomes easier to identify patterns, trends, and relationships. This aids in conducting more accurate and effective analysis.
3. Facilitates decision-making: Classified data provides a clear overview of different aspects, making it easier for decision-makers to derive insights and make informed decisions.
4. Improves data presentation: Classifying data allows for the creation of charts, graphs, and visual representations that make it easier to communicate and present information.
5. Enables comparison: Classification of data enables comparisons between different categories, helping to identify variations and differences that may exist.
Conclusion:
While the reason provided in the statement is partially correct, it does not fully explain the purpose of data classification. Data classification is primarily done to simplify and organize data, making it more manageable and understandable. The ease of calculation is an additional benefit that comes with the classification of data in statistics.
| 1 Crore+ students have signed up on EduRev. Have you? Download the App |
Read the following passage and answer on the basis of the same :The subject-matter of economics is divided into two major branches—Microeconomics and Macroeconomics. Microeconomics studies the economic behaviour of individual economic units and individual economic variables, whereas macroeconomics deals with the functioning of the economy as a whole. Macroeconomics dealswith the broad economic aggregates or bigger issues, such as full employment, unemployment, full capacity, under capacity production, inflation or deflation, etc. Macroeconomics is concerned with the theory of national income, employment, aggregate consumption, savings and investment, general price level, economic growth, etc. Whereas, microeconomics is concerned with the theory of product pricing, factor pricing and consumer behaviour, etc.Positive economics is the branch of economics that concerns the description and explanation of economic phenomena. It focuses on facts and cause and effect behavioural relationships and includes the development and testing of economic theories. Positive economics is objective and facts based. Whereas normative economics is a part of economics that expresses value or normative judgments about economic fairness or what the outcome of the economy or goals of public policy ought to be. Normative economics is subjective and value based.For example, the statement, “government-provided healthcare increases public expenditures” is a positive economic statement and the statement, “government should provide basic healthcare to all citizens” is a normative economic statement.Q. Macroeconomics is concerned with the theory of national income, employment, aggregate consumption, savings and investment, general price level, economic growth.- a)True
- b)False
Correct answer is option 'A'. Can you explain this answer?
Read the following passage and answer on the basis of the same :
The subject-matter of economics is divided into two major branches—Microeconomics and Macroeconomics. Microeconomics studies the economic behaviour of individual economic units and individual economic variables, whereas macroeconomics deals with the functioning of the economy as a whole. Macroeconomics deals
with the broad economic aggregates or bigger issues, such as full employment, unemployment, full capacity, under capacity production, inflation or deflation, etc. Macroeconomics is concerned with the theory of national income, employment, aggregate consumption, savings and investment, general price level, economic growth, etc. Whereas, microeconomics is concerned with the theory of product pricing, factor pricing and consumer behaviour, etc.
Positive economics is the branch of economics that concerns the description and explanation of economic phenomena. It focuses on facts and cause and effect behavioural relationships and includes the development and testing of economic theories. Positive economics is objective and facts based. Whereas normative economics is a part of economics that expresses value or normative judgments about economic fairness or what the outcome of the economy or goals of public policy ought to be. Normative economics is subjective and value based.
For example, the statement, “government-provided healthcare increases public expenditures” is a positive economic statement and the statement, “government should provide basic healthcare to all citizens” is a normative economic statement.
Q. Macroeconomics is concerned with the theory of national income, employment, aggregate consumption, savings and investment, general price level, economic growth.
a)
True
b)
False
|
|
Aryan Khanna answered |
Macroeconomists study topics such as GDP, unemployment rates, national income, price indices, output, consumption, unemployment, inflation, saving, investment, energy, international trade, and international finance.
Directions : In the following questions, a statement of Assertion (A) is followed by a statement of Reason (R). Mark the correct choice as:Assertion (A): False Base line is that portion of the scale which lies between zero and the smallest value of the variable is omitted.Reason (R): One important rule in drawing the graph is that the vertical axis must start from zero.- a)Both Assertion (A) and Reason (R) are true, and Reason (R) is the correct explanation of Assertion (A).
- b)Both Assertion (A) and Reason (R) are true, but Reason (R) is not the correct explanation of Assertion (A).
- c)Assertion (A) is true, but Reason (R) is false .
- d)Assertion (A) is false, but Reason (R) is true.
Correct answer is option 'A'. Can you explain this answer?
Directions : In the following questions, a statement of Assertion (A) is followed by a statement of Reason (R). Mark the correct choice as:
Assertion (A): False Base line is that portion of the scale which lies between zero and the smallest value of the variable is omitted.
Reason (R): One important rule in drawing the graph is that the vertical axis must start from zero.
a)
Both Assertion (A) and Reason (R) are true, and Reason (R) is the correct explanation of Assertion (A).
b)
Both Assertion (A) and Reason (R) are true, but Reason (R) is not the correct explanation of Assertion (A).
c)
Assertion (A) is true, but Reason (R) is false .
d)
Assertion (A) is false, but Reason (R) is true.
|
|
Ishan Choudhury answered |
False Base Line is a device relating to graphical presentation. This line is used to break the continuity of Y-axis with the origin. A false base line is used when figures start with high values. If we maintain continuity of the value from the origin then sufficient portion of the graph would go waste. In the diagram given here, since all the values are confined between 800 and 1100. Therefore, in such a case, a false base line is used. After the false base line, we can start from the actual high figures as shown in the graph.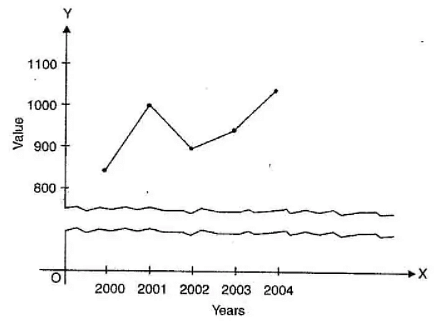
Directions : In the following questions, a statement of Assertion (A) is followed by a statement of Reason (R). Mark the correct choice as:
Assertion (A): The problem of what to produce is related to the scarcity of resources.
Reason (R): Human wants are unlimited, but the resources are scarce.
- a)Assertion (A) is false, but Reason (R) is true.
- b)Both Assertion (A) and Reason (R) are true, but Reason (R) is not the correct explanation of Assertion (A).
- c)Assertion (A) is true, but Reason (R) is false .
- d)Both Assertion (A) and Reason (R) are true, and Reason (R) is the correct explanation of Assertion (A).
Correct answer is option 'D'. Can you explain this answer?
Directions : In the following questions, a statement of Assertion (A) is followed by a statement of Reason (R). Mark the correct choice as:
Assertion (A): The problem of what to produce is related to the scarcity of resources.
Reason (R): Human wants are unlimited, but the resources are scarce.
a)
Assertion (A) is false, but Reason (R) is true.
b)
Both Assertion (A) and Reason (R) are true, but Reason (R) is not the correct explanation of Assertion (A).
c)
Assertion (A) is true, but Reason (R) is false .
d)
Both Assertion (A) and Reason (R) are true, and Reason (R) is the correct explanation of Assertion (A).
|
|
Arun Yadav answered |
The correct answer is:
d) Both Assertion (A) and Reason (R) are true, and Reason (R) is the correct explanation of Assertion (A).
Explanation:
-
Assertion (A): The problem of "what to produce" is indeed related to the scarcity of resources because economies must make choices about which goods and services to produce with the limited resources available.
-
Reason (R): Human wants are unlimited, but resources are scarce, which correctly explains the problem described in the assertion. Due to scarcity, economies cannot produce everything people want, and they must prioritize and allocate resources efficiently.
Thus, Reason (R) accurately explains Assertion (A).
Read the following passage and answer the question that follows:Happiness is considered as a kind of positive emotion which has a significant impact on the physical, cognitive and psychological mechanisms and improves human performance in different fields. This research aims to study the correlation between happiness and death anxiety in health personnel of Zareh hospital in the city of Sari. The current research is a descriptive cross-sectional and correlative study. The population includes all of the health personnel of Zareh hospital located in the city of Sari and they are 226 individuals. Two questionnaires of Oxford Happiness Questionnaire and Templer’s Death Anxiety Questionnaire were completed and surveyed by 144 individuals (97 females and 47 males) of health personnel chosen by simple random sampling. In order to analyze data, the inferential and descriptive statistics including simultaneous equation regression model, Pearson's correlation coefficient, cut-point, and t-test were used for two independent groups. Research results showed that for each one unit of increase in the variable of happiness 0.27 is decreased from the personnel’s’ death anxiety. Thus there is a significant and inverse correlation between two variables of personnel’s happiness and death anxiety. Also another part of the results showed that the difference between females’ happiness and males’ happiness was not significant.Read the following statements–Assertion (A) and Reason (R).Assertion (A): There is a significant and inverse correlation between two variables of personnel’s happiness and death anxiety.Reason (R): Happiness is considered as a kind of positive emotion which has a significant impact on the physical, cognitive and psychological mechanisms and improves human performance in different fields.- a)Both Assertion (A) and Reason (R) are true.
- b)Both Assertion (A) and Reason (R) are false.
Correct answer is option 'A'. Can you explain this answer?
Read the following passage and answer the question that follows:
Happiness is considered as a kind of positive emotion which has a significant impact on the physical, cognitive and psychological mechanisms and improves human performance in different fields. This research aims to study the correlation between happiness and death anxiety in health personnel of Zareh hospital in the city of Sari. The current research is a descriptive cross-sectional and correlative study. The population includes all of the health personnel of Zareh hospital located in the city of Sari and they are 226 individuals. Two questionnaires of Oxford Happiness Questionnaire and Templer’s Death Anxiety Questionnaire were completed and surveyed by 144 individuals (97 females and 47 males) of health personnel chosen by simple random sampling. In order to analyze data, the inferential and descriptive statistics including simultaneous equation regression model, Pearson's correlation coefficient, cut-point, and t-test were used for two independent groups. Research results showed that for each one unit of increase in the variable of happiness 0.27 is decreased from the personnel’s’ death anxiety. Thus there is a significant and inverse correlation between two variables of personnel’s happiness and death anxiety. Also another part of the results showed that the difference between females’ happiness and males’ happiness was not significant.
Read the following statements–Assertion (A) and Reason (R).
Assertion (A): There is a significant and inverse correlation between two variables of personnel’s happiness and death anxiety.
Reason (R): Happiness is considered as a kind of positive emotion which has a significant impact on the physical, cognitive and psychological mechanisms and improves human performance in different fields.
a)
Both Assertion (A) and Reason (R) are true.
b)
Both Assertion (A) and Reason (R) are false.
|
|
Aryan Khanna answered |
Research results showed that for each one unit of increase in the variable of happiness 0.27 is decreased from the personnel's' death anxiety. Thus there is a significant and inverse correlation between two variables of personnel's happiness and death anxiety.
Direction: In the following questions, a statement of Assertion (A) is followed by a statement of Reason (R). Mark the correct choice as:Assertion (A): The vegetable market is a perfect example of perfect competition market.Reason (R): The marketers have no control over the prices of the product.- a)Both Assertion (A) and Reason (R) are true, and Reason (R) is the correct explanation of the Assertion (A).
- b)Both Assertion (A) and Reason (R) are true, but Reason (R) is not the correct explanation of the Assertion (A).
- c)Assertion (A) is true, but Reason (R) is false.
- d)Assertion (A) is false, but Reason (R) is true.
Correct answer is option 'A'. Can you explain this answer?
Direction: In the following questions, a statement of Assertion (A) is followed by a statement of Reason (R). Mark the correct choice as:
Assertion (A): The vegetable market is a perfect example of perfect competition market.
Reason (R): The marketers have no control over the prices of the product.
a)
Both Assertion (A) and Reason (R) are true, and Reason (R) is the correct explanation of the Assertion (A).
b)
Both Assertion (A) and Reason (R) are true, but Reason (R) is not the correct explanation of the Assertion (A).
c)
Assertion (A) is true, but Reason (R) is false.
d)
Assertion (A) is false, but Reason (R) is true.
|
|
Naina Sharma answered |
Perfect competition occurs when all companies sell identical products, market share does not influence price, companies are able to enter or exit without barrier, buyers have “perfect” or full information, and companies cannot determine prices. For example consider a farmers market where each vendor sells the same type of jam. There is little differentiation between each of their products, as they use the same recipe, and they each sell them at an equal price. At the same time, sellers are few and free to participate in the market without any barrier. Buyers, in this case, would be fully knowledgeable of the product's recipe, and any other information relevant to the good.
Direction: In the following questions, a statement of Assertion (A) is followed by a statement of Reason (R). Mark the correct choice as:Assertion (A): For calculating Arithmetic mean, when Cumulative frequencies are given, the frequencies are to be found for the given series or variables.Reason (R): Cumulative frequencies are calculated by adding the frequencies.- a)Both Assertion (A) and Reason (R) are true, and Reason (R) is the correct explanation of the Assertion (A).
- b)Both Assertion (A) and Reason (R) are true, but Reason (R) is not the correct explanation of the Assertion (A).
- c)Assertion (A) is true, but Reason (R) is false.
- d)Assertion (A) is false, but Reason (R) is true.
Correct answer is option 'B'. Can you explain this answer?
Direction: In the following questions, a statement of Assertion (A) is followed by a statement of Reason (R). Mark the correct choice as:
Assertion (A): For calculating Arithmetic mean, when Cumulative frequencies are given, the frequencies are to be found for the given series or variables.
Reason (R): Cumulative frequencies are calculated by adding the frequencies.
a)
Both Assertion (A) and Reason (R) are true, and Reason (R) is the correct explanation of the Assertion (A).
b)
Both Assertion (A) and Reason (R) are true, but Reason (R) is not the correct explanation of the Assertion (A).
c)
Assertion (A) is true, but Reason (R) is false.
d)
Assertion (A) is false, but Reason (R) is true.
|
|
Arun Yadav answered |
The arithmetic mean of the following observation 4, 8, 12, 16, is 10. 3. Cumulative frequency is needed while finding the median of the distribution. In case of calculation of median after arranging the data in ascending or descending order, the cumulative frequencies are calculated.
Direction: In the following questions, a statement of Assertion (A) is followed by a statement of Reason (R). Mark the correct choice as:Assertion (A): Oil Producing Companies have an oligopoly market.Reason (R): There are only few countries that produce and export crude oil in the whole world.- a)Both Assertion (A) and Reason (R) are true, and Reason (R) is the correct explanation of the Assertion (A).
- b)Both Assertion (A) and Reason (R) are true, but Reason (R) is not the correct explanation of the Assertion (A).
- c)Assertion (A) is true, but Reason (R) is false.
- d)Assertion (A) is false, but Reason (R) is true.
Correct answer is option 'A'. Can you explain this answer?
Direction: In the following questions, a statement of Assertion (A) is followed by a statement of Reason (R). Mark the correct choice as:
Assertion (A): Oil Producing Companies have an oligopoly market.
Reason (R): There are only few countries that produce and export crude oil in the whole world.
a)
Both Assertion (A) and Reason (R) are true, and Reason (R) is the correct explanation of the Assertion (A).
b)
Both Assertion (A) and Reason (R) are true, but Reason (R) is not the correct explanation of the Assertion (A).
c)
Assertion (A) is true, but Reason (R) is false.
d)
Assertion (A) is false, but Reason (R) is true.
|
|
Priyanka Khatri answered |
Throughout history, there have been oligopolies in many different industries, including steel manufacturing, oil, railroads, tire manufacturing, grocery store chains, and wireless carriers. Other industries with an oligopoly structure are airlines and pharmaceuticals.
Directions : In the following questions, a statement of Assertion (A) is followed by a statement of Reason (R). Mark the correct choice as:Assertion (A): Combined mean is calculated by multiplying the means with their respective frequencies total and then added and divided by the total number of items.Reason (R): In weighted mean, the weights are assigned to the respective items in the series and then the mean is calculated.- a)Both Assertion (A) and Reason (R) are true, and Reason (R) is the correct explanation of Assertion (A).
- b)Both Assertion (A) and Reason (R) are true, but Reason (R) is not the correct explanation of Assertion (A).
- c)Assertion (A) is true, but Reason (R) is false .
- d)Assertion (A) is false, but Reason (R) is true.
Correct answer is option 'B'. Can you explain this answer?
Directions : In the following questions, a statement of Assertion (A) is followed by a statement of Reason (R). Mark the correct choice as:
Assertion (A): Combined mean is calculated by multiplying the means with their respective frequencies total and then added and divided by the total number of items.
Reason (R): In weighted mean, the weights are assigned to the respective items in the series and then the mean is calculated.
a)
Both Assertion (A) and Reason (R) are true, and Reason (R) is the correct explanation of Assertion (A).
b)
Both Assertion (A) and Reason (R) are true, but Reason (R) is not the correct explanation of Assertion (A).
c)
Assertion (A) is true, but Reason (R) is false .
d)
Assertion (A) is false, but Reason (R) is true.
|
|
Arun Yadav answered |
The weighted mean is a type of mean that is calculated by multiplying the weight (or probability) associated with a particular event or outcome with its associated quantitative outcome and then summing all the products together. It is very useful when calculating a theoretically expected outcome where each outcome has a different probability of occurring, which is the key feature that distinguishes the weighted mean from the arithmetic mean.
Identify the correct pair of terms with their formula from the following Columns I and II: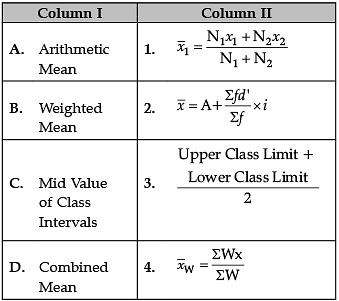
- a)A–1
- b)B–2
- c)C–3
- d)D–4
Correct answer is option 'C'. Can you explain this answer?
Identify the correct pair of terms with their formula from the following Columns I and II:
a)
A–1
b)
B–2
c)
C–3
d)
D–4

|
Notes Wala answered |
Correct Formulas are
A. Arithmetic Mean: 
B. Weighted Mean: 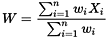
C. Mid Value of Class Intervals: 
D. Combined Mean: 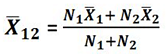
Direction: In the following questions, a statement of Assertion (A) is followed by a statement of Reason (R). Mark the correct choice as:Assertion (A): The Index Number shows the change in the relative price from the base year.Reason (R): Index number is calculated as a ratio of current price with the base price.- a)Both Assertion (A) and Reason (R) are true, and Reason (R) is the correct explanation of the Assertion (A).
- b)Both Assertion (A) and Reason (R) are true, but Reason (R) is not the correct explanation of the Assertion (A).
- c)Assertion (A) is true, but Reason (R) is false.
- d)Assertion (A) is false, but Reason (R) is true.
Correct answer is option 'B'. Can you explain this answer?
Direction: In the following questions, a statement of Assertion (A) is followed by a statement of Reason (R). Mark the correct choice as:
Assertion (A): The Index Number shows the change in the relative price from the base year.
Reason (R): Index number is calculated as a ratio of current price with the base price.
a)
Both Assertion (A) and Reason (R) are true, and Reason (R) is the correct explanation of the Assertion (A).
b)
Both Assertion (A) and Reason (R) are true, but Reason (R) is not the correct explanation of the Assertion (A).
c)
Assertion (A) is true, but Reason (R) is false.
d)
Assertion (A) is false, but Reason (R) is true.
|
|
Ishan Choudhury answered |
Index number in statistics is the measurement of change in a variable or variables across a determined period. It will show general relative change and not a directly measurable figure. An index number is expressed in percentage form.
Direction: Read the following passage and answer the question that follows:The slope of a total revenue curve is particularly important. It equals the change in the vertical axis (total revenue) divided by the change in the horizontal axis (quantity) between any two points. The slope measures the rate at which total revenue increases as output increases. We can think of it as the increase in total revenue associated with a 1-unit increase in output. The increase in total revenue from a 1-unit increase in quantity is marginal revenue. Thus marginal revenue (MR) equals the slope of the total revenue curve.How much additional revenue does a radish producer gain from selling one more pound of radishes? The answer, of course, is the market price for 1 pound. Marginal revenue equals the market price. Because the market price is not affected by the output choice of a single firm, the marginal revenue the firm gains by producing one more unit is always the market price. The marginal revenue curve shows the relationship between marginal revenue and the quantity a firm produces. For a perfectly competitive firm, the marginal revenue curve is a horizontal line at the market price. If the market price of a pound of radishes is $0.40, then the marginal revenue is $0.40. Marginal revenue curves for prices of $0.20, $0.40, and $0.60. In perfect competition, a firm’s marginal revenue curve is a horizontal line at the market price.Price also equals average revenue, which is total revenue divided by quantity. To obtain average revenue (AR), we divide total revenue by quantity, Q. Because total revenue equals price (P) times quantity (Q), dividing by quantity leaves us with price.Q. The slope of the Total Revenue equals ……..- a)Average Revenue
- b)Marginal Revenue
- c)Average Cost
- d)Marginal Cost
Correct answer is option 'B'. Can you explain this answer?
Direction: Read the following passage and answer the question that follows:
The slope of a total revenue curve is particularly important. It equals the change in the vertical axis (total revenue) divided by the change in the horizontal axis (quantity) between any two points. The slope measures the rate at which total revenue increases as output increases. We can think of it as the increase in total revenue associated with a 1-unit increase in output. The increase in total revenue from a 1-unit increase in quantity is marginal revenue. Thus marginal revenue (MR) equals the slope of the total revenue curve.
How much additional revenue does a radish producer gain from selling one more pound of radishes? The answer, of course, is the market price for 1 pound. Marginal revenue equals the market price. Because the market price is not affected by the output choice of a single firm, the marginal revenue the firm gains by producing one more unit is always the market price. The marginal revenue curve shows the relationship between marginal revenue and the quantity a firm produces. For a perfectly competitive firm, the marginal revenue curve is a horizontal line at the market price. If the market price of a pound of radishes is $0.40, then the marginal revenue is $0.40. Marginal revenue curves for prices of $0.20, $0.40, and $0.60. In perfect competition, a firm’s marginal revenue curve is a horizontal line at the market price.
Price also equals average revenue, which is total revenue divided by quantity. To obtain average revenue (AR), we divide total revenue by quantity, Q. Because total revenue equals price (P) times quantity (Q), dividing by quantity leaves us with price.
Q. The slope of the Total Revenue equals ……..
a)
Average Revenue
b)
Marginal Revenue
c)
Average Cost
d)
Marginal Cost
|
|
Vikas Kapoor answered |
At the point of maximum total revenue m the slope of the total revenue curve is zero and the marginal revenue is therefore also zero. The marginal revenue curve thus crosses the horizontal axis at the quantity at which the total revenue is maximum.
Directions : In the following questions, a statement of Assertion (A) is followed by a statement of Reason (R). Mark the correct choice as:Assertion (A): Mode is affected by the extreme values.Reason (R): In mode, total cannot be obtained.- a)Both Assertion (A) and Reason (R) are true, and Reason (R) is the correct explanation of Assertion (A).
- b)Both Assertion (A) and Reason (R) are true, but Reason (R) is not the correct explanation of Assertion (A).
- c)Assertion (A) is true, but Reason (R) is false .
- d)Assertion (A) is false, but Reason (R) is true.
Correct answer is option 'D'. Can you explain this answer?
Directions : In the following questions, a statement of Assertion (A) is followed by a statement of Reason (R). Mark the correct choice as:
Assertion (A): Mode is affected by the extreme values.
Reason (R): In mode, total cannot be obtained.
a)
Both Assertion (A) and Reason (R) are true, and Reason (R) is the correct explanation of Assertion (A).
b)
Both Assertion (A) and Reason (R) are true, but Reason (R) is not the correct explanation of Assertion (A).
c)
Assertion (A) is true, but Reason (R) is false .
d)
Assertion (A) is false, but Reason (R) is true.
|
|
Kiran Mehta answered |
The mode is the value that appears most frequently in a data set. A set of data may have one mode, more than one mode, or no mode at all. Other popular measures of central tendency include the mean, or the average of a set, and the median, the middle value in a set.
Direction: Read the following passage and answer the question that follows:A producer (firm) is said to be in equilibrium when the firm is producing that quantity of output which gives the firm maximum profit.For a firm, to be in equilibrium, two conditions must be fulfilled. First, and the necessary condition is that firm’s marginal cost equals marginal revenue.Second, along with the first condition is that MC must be greater than MR beyond the level of output at which MC = MR. Therefore, fulfilment of the first condition alone does not ensure maximum profits. It is possible that MC = MR condition may be fulfilled at more than one output level but only that output level beyond which MC > MR is the maximum profits output level.Q. What is the first and necessary condition for equilibrium?- a)MC is more than MR.
- b)MC is less than MR.
- c)MC is equal to MR.
- d)MC is above MR.
Correct answer is option 'C'. Can you explain this answer?
Direction: Read the following passage and answer the question that follows:
A producer (firm) is said to be in equilibrium when the firm is producing that quantity of output which gives the firm maximum profit.
For a firm, to be in equilibrium, two conditions must be fulfilled. First, and the necessary condition is that firm’s marginal cost equals marginal revenue.
Second, along with the first condition is that MC must be greater than MR beyond the level of output at which MC = MR. Therefore, fulfilment of the first condition alone does not ensure maximum profits. It is possible that MC = MR condition may be fulfilled at more than one output level but only that output level beyond which MC > MR is the maximum profits output level.
Q. What is the first and necessary condition for equilibrium?
a)
MC is more than MR.
b)
MC is less than MR.
c)
MC is equal to MR.
d)
MC is above MR.

|
Ishani Yadav answered |
First and Necessary Condition for Equilibrium:
The first and necessary condition for equilibrium in a firm is that the firm's marginal cost (MC) equals marginal revenue (MR). In other words, the rate at which the cost of producing an additional unit of output (MC) is equal to the additional revenue earned from selling that unit (MR).
Explanation:
- Equilibrium in a Firm: Equilibrium in a firm refers to the state where the firm is producing the quantity of output that maximizes its profit. It is the point at which the firm has optimized its production and pricing decisions to achieve the highest level of profit.
- MC = MR: To be in equilibrium, the first condition that must be fulfilled is that the firm's marginal cost (MC) must equal marginal revenue (MR). Marginal cost is the additional cost incurred by the firm in producing one more unit of output, while marginal revenue is the additional revenue earned from selling that additional unit of output.
- Importance of MC = MR: When MC is equal to MR, it implies that the firm is neither overproducing nor underproducing. If MC is less than MR, it means that the firm can increase its profit by producing more units of output. On the other hand, if MC is greater than MR, it indicates that the firm can increase its profit by producing fewer units of output.
- Maximum Profit: The second condition for equilibrium is that the firm's MC must be greater than MR beyond the level of output at which MC = MR. This means that while MC = MR may be fulfilled at more than one output level, only the output level beyond which MC > MR will result in maximum profits for the firm.
- Significance: The fulfillment of the first condition alone, where MC equals MR, does not ensure maximum profits for the firm. It is the combination of MC = MR and MC > MR that leads to the determination of the optimal output level, which maximizes the firm's profit.
In conclusion, the first and necessary condition for equilibrium in a firm is that the firm's marginal cost (MC) equals marginal revenue (MR). This condition ensures that the firm is producing the quantity of output that maximizes its profit. However, it is important to note that MC > MR beyond the level of output at which MC = MR is also required for the firm to achieve maximum profits.
Read the following passage and answer the question that follows:Happiness is considered as a kind of positive emotion which has a significant impact on the physical, cognitive and psychological mechanisms and improves human performance in different fields. This research aims to study the correlation between happiness and death anxiety in health personnel of Zareh hospital in the city of Sari. The current research is a descriptive cross-sectional and correlative study. The population includes all of the health personnel of Zareh hospital located in the city of Sari and they are 226 individuals. Two questionnaires of Oxford Happiness Questionnaire and Templer’s Death Anxiety Questionnaire were completed and surveyed by 144 individuals (97 females and 47 males) of health personnel chosen by simple random sampling. In order to analyze data, the inferential and descriptive statistics including simultaneous equation regression model, Pearson's correlation coefficient, cut-point, and t-test were used for two independent groups. Research results showed that for each one unit of increase in the variable of happiness 0.27 is decreased from the personnel’s’ death anxiety. Thus there is a significant and inverse correlation between two variables of personnel’s happiness and death anxiety. Also another part of the results showed that the difference between females’ happiness and males’ happiness was not significant.Q. ..................... (//) between happiness and death anxiety is being studied.- a)Correlation
- b)Regression
- c)Index number
- d)All of above
Correct answer is option 'A'. Can you explain this answer?
Read the following passage and answer the question that follows:
Happiness is considered as a kind of positive emotion which has a significant impact on the physical, cognitive and psychological mechanisms and improves human performance in different fields. This research aims to study the correlation between happiness and death anxiety in health personnel of Zareh hospital in the city of Sari. The current research is a descriptive cross-sectional and correlative study. The population includes all of the health personnel of Zareh hospital located in the city of Sari and they are 226 individuals. Two questionnaires of Oxford Happiness Questionnaire and Templer’s Death Anxiety Questionnaire were completed and surveyed by 144 individuals (97 females and 47 males) of health personnel chosen by simple random sampling. In order to analyze data, the inferential and descriptive statistics including simultaneous equation regression model, Pearson's correlation coefficient, cut-point, and t-test were used for two independent groups. Research results showed that for each one unit of increase in the variable of happiness 0.27 is decreased from the personnel’s’ death anxiety. Thus there is a significant and inverse correlation between two variables of personnel’s happiness and death anxiety. Also another part of the results showed that the difference between females’ happiness and males’ happiness was not significant.
Q. ..................... (//) between happiness and death anxiety is being studied.
a)
Correlation
b)
Regression
c)
Index number
d)
All of above
|
|
Amita Das answered |
Research results showed that for each one unit of increase in the variable of happiness 0.27 is decreased from the personnel's' death anxiety. Thus there is a significant and inverse correlation between two variables of personnel's happiness and death anxiety.
Directions : In the following questions, a statement of Assertion (A) is followed by a statement of Reason (R). Mark the correct choice as:Assertion (A): A table needs to be attractive and simple.Reason (R): Tables are prepared to make the statistics very lengthy.- a)Both Assertion (A) and Reason (R) are true, and Reason (R) is the correct explanation of Assertion (A).
- b)Both Assertion (A) and Reason (R) are true, but Reason (R) is not the correct explanation of Assertion (A).
- c)Assertion (A) is true, but Reason (R) is false .
- d)Assertion (A) is false, but Reason (R) is true.
Correct answer is option 'C'. Can you explain this answer?
Directions : In the following questions, a statement of Assertion (A) is followed by a statement of Reason (R). Mark the correct choice as:
Assertion (A): A table needs to be attractive and simple.
Reason (R): Tables are prepared to make the statistics very lengthy.
a)
Both Assertion (A) and Reason (R) are true, and Reason (R) is the correct explanation of Assertion (A).
b)
Both Assertion (A) and Reason (R) are true, but Reason (R) is not the correct explanation of Assertion (A).
c)
Assertion (A) is true, but Reason (R) is false .
d)
Assertion (A) is false, but Reason (R) is true.

|
Raghav Yadav answered |
Assertion (A): A table needs to be attractive and simple.
Reason (R): Tables are prepared to make the statistics very lengthy.
The correct answer is option 'C' - Assertion (A) is true, but Reason (R) is false.
Explanation:
In this question, we are given an assertion and a reason related to the need for a table to be attractive and simple. Let's analyze each statement separately.
Assertion (A): A table needs to be attractive and simple.
Tables are a commonly used tool in various fields, including commerce, to present data and statistics in a systematic and organized manner. An attractive and simple table can enhance the visual appeal of the information presented and make it easier for the audience to understand and interpret the data. A well-designed table with clear headings, proper formatting, and appropriate use of colors can make the information more engaging and accessible.
Reason (R): Tables are prepared to make the statistics very lengthy.
This reason is incorrect. Tables are not prepared specifically to make statistics lengthy. The purpose of a table is to present data in a concise and structured format. While tables can accommodate large amounts of data, their primary goal is to provide a clear and organized representation of information. Tables can be used to present both small and large datasets, and their length is determined by the amount of data being presented, not the intention to make statistics lengthy.
Therefore, the correct answer is option 'C' - Assertion (A) is true, but Reason (R) is false.
Reason (R): Tables are prepared to make the statistics very lengthy.
The correct answer is option 'C' - Assertion (A) is true, but Reason (R) is false.
Explanation:
In this question, we are given an assertion and a reason related to the need for a table to be attractive and simple. Let's analyze each statement separately.
Assertion (A): A table needs to be attractive and simple.
Tables are a commonly used tool in various fields, including commerce, to present data and statistics in a systematic and organized manner. An attractive and simple table can enhance the visual appeal of the information presented and make it easier for the audience to understand and interpret the data. A well-designed table with clear headings, proper formatting, and appropriate use of colors can make the information more engaging and accessible.
Reason (R): Tables are prepared to make the statistics very lengthy.
This reason is incorrect. Tables are not prepared specifically to make statistics lengthy. The purpose of a table is to present data in a concise and structured format. While tables can accommodate large amounts of data, their primary goal is to provide a clear and organized representation of information. Tables can be used to present both small and large datasets, and their length is determined by the amount of data being presented, not the intention to make statistics lengthy.
Therefore, the correct answer is option 'C' - Assertion (A) is true, but Reason (R) is false.
Direction: In the following questions, a statement of Assertion (A) is followed by a statement of Reason (R). Mark the correct choice as:Assertion (A): Increasing returns to a factor is a short run phenomenon.Reason (R): Greater application of the variable factor ensures fully utilization of the fixed factor.- a)Both Assertion (A) and Reason (R) are true, and Reason (R) is the correct explanation of the Assertion (A).
- b)Both Assertion (A) and Reason (R) are true, but Reason (R) is not the correct explanation of the Assertion (A).
- c)Assertion (A) is true, but Reason (R) is false.
- d)Assertion (A) is false, but Reason (R) is true.
Correct answer is option 'B'. Can you explain this answer?
Direction: In the following questions, a statement of Assertion (A) is followed by a statement of Reason (R). Mark the correct choice as:
Assertion (A): Increasing returns to a factor is a short run phenomenon.
Reason (R): Greater application of the variable factor ensures fully utilization of the fixed factor.
a)
Both Assertion (A) and Reason (R) are true, and Reason (R) is the correct explanation of the Assertion (A).
b)
Both Assertion (A) and Reason (R) are true, but Reason (R) is not the correct explanation of the Assertion (A).
c)
Assertion (A) is true, but Reason (R) is false.
d)
Assertion (A) is false, but Reason (R) is true.
|
|
Priyanka Khatri answered |
The Law of Increasing Returns may be defined as such “As the proportion of one factor in a combination of factors is increased up to a point, the marginal product of the factor will increase. The phrase 'up to a point' may be carefully noted. The increasing return will be only up to a point.
Directions : In the following questions, a statement of Assertion (A) is followed by a statement of Reason (R). Mark the correct choice as:Assertion (A): The government is planning to introduce a bill for the control of population inIndia. This type of decision is covered in Positive Economics.Reason (R): Positive Economics concerns the description and explanation of economic phenomenon.- a)Both Assertion (A) and Reason (R) are true, and Reason (R) is the correct explanation of Assertion (A).
- b)Both Assertion (A) and Reason (R) are true, but Reason (R) is not the correct explanation of Assertion (A).
- c)Assertion (A) is true, but Reason (R) is false .
- d)Assertion (A) is false, but Reason (R) is true.
Correct answer is option 'D'. Can you explain this answer?
Directions : In the following questions, a statement of Assertion (A) is followed by a statement of Reason (R). Mark the correct choice as:
Assertion (A): The government is planning to introduce a bill for the control of population in
India. This type of decision is covered in Positive Economics.
Reason (R): Positive Economics concerns the description and explanation of economic phenomenon.
a)
Both Assertion (A) and Reason (R) are true, and Reason (R) is the correct explanation of Assertion (A).
b)
Both Assertion (A) and Reason (R) are true, but Reason (R) is not the correct explanation of Assertion (A).
c)
Assertion (A) is true, but Reason (R) is false .
d)
Assertion (A) is false, but Reason (R) is true.
|
|
Kiran Mehta answered |
The term positive economics refers to the objective analysis in the study of economics. Most economists look at what has happened and what is currently happening in a given economy to form their basis of predictions for the future. This investigative process is positive economics. Conversely, a normative economic study bases future predictions on value judgments.
Directions : In the following questions, a statement of Assertion (A) is followed by a statement of Reason (R). Mark the correct choice as:Assertion (A): Ram made a table for all the expenditure he has incurred during a week to calculate the total amount spent by him.Reason (R): Tables help in simplified calculation of the data in a systematic manner.- a)Both Assertion (A) and Reason (R) are true, and Reason (R) is the correct explanation of Assertion (A).
- b)Both Assertion (A) and Reason (R) are true, but Reason (R) is not the correct explanation of Assertion (A).
- c)Assertion (A) is true, but Reason (R) is false .
- d)Assertion (A) is false, but Reason (R) is true.
Correct answer is option 'A'. Can you explain this answer?
Directions : In the following questions, a statement of Assertion (A) is followed by a statement of Reason (R). Mark the correct choice as:
Assertion (A): Ram made a table for all the expenditure he has incurred during a week to calculate the total amount spent by him.
Reason (R): Tables help in simplified calculation of the data in a systematic manner.
a)
Both Assertion (A) and Reason (R) are true, and Reason (R) is the correct explanation of Assertion (A).
b)
Both Assertion (A) and Reason (R) are true, but Reason (R) is not the correct explanation of Assertion (A).
c)
Assertion (A) is true, but Reason (R) is false .
d)
Assertion (A) is false, but Reason (R) is true.

|
Aditya Sen answered |
Assertion (A): Ram made a table for all the expenditure he has incurred during a week to calculate the total amount spent by him.
Reason (R): Tables help in simplified calculation of the data in a systematic manner.
The correct answer is option 'A': Both Assertion (A) and Reason (R) are true, and Reason (R) is the correct explanation of Assertion (A).
Explanation:
Assertion (A): Ram made a table for all the expenditure he has incurred during a week to calculate the total amount spent by him.
When Ram made a table for all the expenditure he has incurred during a week, it means he organized the data in a tabular form. This allows him to record and categorize his expenses systematically, making it easier for him to calculate the total amount spent. By having a table, he can have a clear overview of his expenses and identify any patterns or areas where he needs to cut back.
Reason (R): Tables help in simplified calculation of the data in a systematic manner.
Tables are a useful tool for organizing and presenting data in a structured manner. They provide a systematic way of representing information, making it easier to analyze and calculate. In the case of Ram, having a table for his expenditures allows him to input the relevant data and perform calculations more efficiently. The rows and columns of a table help in categorizing different types of expenses, and the cells within the table can be used to input specific amounts. This organized format simplifies the calculation process and enables Ram to calculate the total amount spent accurately.
Thus, both Assertion (A) and Reason (R) are true, and Reason (R) is the correct explanation of Assertion (A).
Reason (R): Tables help in simplified calculation of the data in a systematic manner.
The correct answer is option 'A': Both Assertion (A) and Reason (R) are true, and Reason (R) is the correct explanation of Assertion (A).
Explanation:
Assertion (A): Ram made a table for all the expenditure he has incurred during a week to calculate the total amount spent by him.
When Ram made a table for all the expenditure he has incurred during a week, it means he organized the data in a tabular form. This allows him to record and categorize his expenses systematically, making it easier for him to calculate the total amount spent. By having a table, he can have a clear overview of his expenses and identify any patterns or areas where he needs to cut back.
Reason (R): Tables help in simplified calculation of the data in a systematic manner.
Tables are a useful tool for organizing and presenting data in a structured manner. They provide a systematic way of representing information, making it easier to analyze and calculate. In the case of Ram, having a table for his expenditures allows him to input the relevant data and perform calculations more efficiently. The rows and columns of a table help in categorizing different types of expenses, and the cells within the table can be used to input specific amounts. This organized format simplifies the calculation process and enables Ram to calculate the total amount spent accurately.
Thus, both Assertion (A) and Reason (R) are true, and Reason (R) is the correct explanation of Assertion (A).
Directions : In the following questions, a statement of Assertion (A) is followed by a statement of Reason (R). Mark the correct choice as:Assertion (A): Statistical error is the difference between the observed and the true value.Reason (R): Statistical error can be sampling error and non-sampling error.- a)Both Assertion (A) and Reason (R) are true, and Reason (R) is the correct explanation of Assertion (A).
- b)Both Assertion (A) and Reason (R) are true, but Reason (R) is not the correct explanation of Assertion (A).
- c)Assertion (A) is true, but Reason (R) is false .
- d)Assertion (A) is false, but Reason (R) is true.
Correct answer is option 'B'. Can you explain this answer?
Directions : In the following questions, a statement of Assertion (A) is followed by a statement of Reason (R). Mark the correct choice as:
Assertion (A): Statistical error is the difference between the observed and the true value.
Reason (R): Statistical error can be sampling error and non-sampling error.
a)
Both Assertion (A) and Reason (R) are true, and Reason (R) is the correct explanation of Assertion (A).
b)
Both Assertion (A) and Reason (R) are true, but Reason (R) is not the correct explanation of Assertion (A).
c)
Assertion (A) is true, but Reason (R) is false .
d)
Assertion (A) is false, but Reason (R) is true.
|
|
Naina Sharma answered |
The accuracy of a survey estimate refers to the closeness of the estimate to the true population value. Where there is a discrepancy between the value of the survey estimate and true population value, the difference between the two is referred to as the error of the survey estimate.
Direction: In the following questions, a statement of Assertion (A) is followed by a statement of Reason (R). Mark the correct choice as:Assertion (A): Increasing returns to a factor is a short run phenomenon.Reason (R): Greater application of the variable factor ensures fully utilization of the fixed factor.- a)Both Assertion (A) and Reason (R) are true, and Reason (R) is the correct explanation of the Assertion (A).
- b)Both Assertion (A) and Reason (R) are true, but Reason (R) is not the correct explanation of the Assertion (A).
- c)Assertion (A) is true, but Reason (R) is false.
- d)Assertion (A) is false, but Reason (R) is true.
Correct answer is option 'B'. Can you explain this answer?
Direction: In the following questions, a statement of Assertion (A) is followed by a statement of Reason (R). Mark the correct choice as:
Assertion (A): Increasing returns to a factor is a short run phenomenon.
Reason (R): Greater application of the variable factor ensures fully utilization of the fixed factor.
a)
Both Assertion (A) and Reason (R) are true, and Reason (R) is the correct explanation of the Assertion (A).
b)
Both Assertion (A) and Reason (R) are true, but Reason (R) is not the correct explanation of the Assertion (A).
c)
Assertion (A) is true, but Reason (R) is false.
d)
Assertion (A) is false, but Reason (R) is true.
|
|
Kiran Mehta answered |
Increasing returns to scale relate to the long run in which all inputs are variable. Increasing marginal returns related to the short run in which one or more input is variable and one or more input is fixed.
Directions : In the following questions, a statement of Assertion (A) is followed by a statement of Reason (R). Mark the correct choice as:Assertion (A): Tables are used to clarify the object of the investigation.Reason (R): Tables are the systematic presentation of the data.- a)Both Assertion (A) and Reason (R) are true, and Reason (R) is the correct explanation of Assertion (A).
- b)Both Assertion (A) and Reason (R) are true, but Reason (R) is not the correct explanation of Assertion (A).
- c)Assertion (A) is true, but Reason (R) is false .
- d)Assertion (A) is false, but Reason (R) is true.
Correct answer is option 'B'. Can you explain this answer?
Directions : In the following questions, a statement of Assertion (A) is followed by a statement of Reason (R). Mark the correct choice as:
Assertion (A): Tables are used to clarify the object of the investigation.
Reason (R): Tables are the systematic presentation of the data.
a)
Both Assertion (A) and Reason (R) are true, and Reason (R) is the correct explanation of Assertion (A).
b)
Both Assertion (A) and Reason (R) are true, but Reason (R) is not the correct explanation of Assertion (A).
c)
Assertion (A) is true, but Reason (R) is false .
d)
Assertion (A) is false, but Reason (R) is true.

|
Srestha Choudhury answered |
Assertion and Reasoning: Tables in Investigation
Assertion (A): Tables are used to clarify the object of the investigation.
Reason (R): Tables are the systematic presentation of the data.
Explanation:
Tables are widely used in research and investigations to present data in an organized and structured format. The Assertion (A) states that tables are used to clarify the object of the investigation. This statement is true because tables help to present the data in a clear and concise manner. Tables are used to summarize, compare, and contrast data, which makes it easier for the researcher to analyze and understand the information.
The Reason (R) states that tables are the systematic presentation of the data. This statement is also true because tables are a structured and organized way to present data. Tables help to organize large amounts of information and present them in a logical and systematic manner. This makes it easier for the reader to understand and analyze the data presented.
Therefore, both Assertion (A) and Reason (R) are true. However, Reason (R) alone is not the correct explanation of Assertion (A). The reason why tables are used in investigations is not only because they are a systematic presentation of data but also because they help to clarify the object of the investigation.
Hence, the correct answer is option (B).
Direction: In the following questions, a statement of Assertion (A) is followed by a statement of Reason (R). Mark the correct choice as:Assertion (A): Average Cost will rise only when Marginal Cost rises.Reason (R): Rise in AC takes place when MC is greater than AC and not necessarily when MC rises.- a)Both Assertion (A) and Reason (R) are true, and Reason (R) is the correct explanation of the Assertion (A).
- b)Both Assertion (A) and Reason (R) are true, but Reason (R) is not the correct explanation of the Assertion (A).
- c)Assertion (A) is true, but Reason (R) is false.
- d)Assertion (A) is false, but Reason (R) is true.
Correct answer is option 'D'. Can you explain this answer?
Direction: In the following questions, a statement of Assertion (A) is followed by a statement of Reason (R). Mark the correct choice as:
Assertion (A): Average Cost will rise only when Marginal Cost rises.
Reason (R): Rise in AC takes place when MC is greater than AC and not necessarily when MC rises.
a)
Both Assertion (A) and Reason (R) are true, and Reason (R) is the correct explanation of the Assertion (A).
b)
Both Assertion (A) and Reason (R) are true, but Reason (R) is not the correct explanation of the Assertion (A).
c)
Assertion (A) is true, but Reason (R) is false.
d)
Assertion (A) is false, but Reason (R) is true.
|
|
Amita Das answered |
Average cost rises only when Marginal Cost is greater than Average Cost. Average cost falls as long as marginal cost is below average cost (irrespective of the fact that marginal cost is rising or falling).
Directions : In the following questions, a statement of Assertion (A) is followed by a statement of Reason (R). Mark the correct choice as:Assertion (A): Law of diminishing marginal utility states that as more and more units of a commodity are consumed, marginal utility derived from every additional unit must decline.Reason (R): When MU is negative, TU will be decreasing.- a)Both Assertion (A) and Reason (R) are true, and Reason (R) is the correct explanation of Assertion (A).
- b)Both Assertion (A) and Reason (R) are true, but Reason (R) is not the correct explanation of Assertion (A).
- c)Assertion (A) is true, but Reason (R) is false .
- d)Assertion (A) is false, but Reason (R) is true.
Correct answer is option 'B'. Can you explain this answer?
Directions : In the following questions, a statement of Assertion (A) is followed by a statement of Reason (R). Mark the correct choice as:
Assertion (A): Law of diminishing marginal utility states that as more and more units of a commodity are consumed, marginal utility derived from every additional unit must decline.
Reason (R): When MU is negative, TU will be decreasing.
a)
Both Assertion (A) and Reason (R) are true, and Reason (R) is the correct explanation of Assertion (A).
b)
Both Assertion (A) and Reason (R) are true, but Reason (R) is not the correct explanation of Assertion (A).
c)
Assertion (A) is true, but Reason (R) is false .
d)
Assertion (A) is false, but Reason (R) is true.

|
Srishti Kaur answered |
Law of Diminishing Marginal Utility
The law of diminishing marginal utility is an economic concept that states that as more and more units of a commodity are consumed, the marginal utility derived from every additional unit must decline. In other words, the satisfaction or utility obtained from consuming each additional unit of a good or service decreases as the quantity consumed increases.
Negative Marginal Utility and Total Utility
When the marginal utility (MU) of a commodity is negative, it means that consuming an additional unit of the commodity actually reduces the total utility (TU) derived from consuming the previous units. This occurs when the additional unit is of lower quality or has a negative effect on overall satisfaction.
Explanation of the Assertion and Reason
Assertion (A): The law of diminishing marginal utility states that as more and more units of a commodity are consumed, marginal utility derived from every additional unit must decline.
Reason (R): When MU is negative, TU will be decreasing.
The correct answer is option 'B' - Both Assertion (A) and Reason (R) are true, but Reason (R) is not the correct explanation of Assertion (A).
The law of diminishing marginal utility is a well-established concept in economics, which suggests that as consumption of a commodity increases, the marginal utility derived from each additional unit consumed will decrease. This is because individuals tend to satisfy their most urgent needs or desires first, and as they consume more, the satisfaction gained from each additional unit diminishes.
On the other hand, the reason provided in the statement is not an accurate explanation of the law of diminishing marginal utility. While it is true that when the marginal utility is negative, the total utility will decrease, it does not fully explain the concept of diminishing marginal utility. The law of diminishing marginal utility applies even when the marginal utility is positive but decreasing.
Therefore, while both the assertion and reason are true, the reason does not provide a correct explanation for the assertion. The law of diminishing marginal utility is a broader concept that applies to all situations where marginal utility decreases with increased consumption, regardless of whether the marginal utility is negative or positive.
Directions : In the following questions, a statement of Assertion (A) is followed by a statement of Reason (R). Mark the correct choice as:Assertion (A): The basic problem arises due to the unlimited nature of human want.Reason (R): Human want is the desire, aspiration and motives of humans.- a)Both Assertion (A) and Reason (R) are true, and Reason (R) is the correct explanation of Assertion (A).
- b)Both Assertion (A) and Reason (R) are true, but Reason (R) is not the correct explanation of Assertion (A).
- c)Assertion (A) is true, but Reason (R) is false .
- d)Assertion (A) is false, but Reason (R) is true.
Correct answer is option 'B'. Can you explain this answer?
Directions : In the following questions, a statement of Assertion (A) is followed by a statement of Reason (R). Mark the correct choice as:
Assertion (A): The basic problem arises due to the unlimited nature of human want.
Reason (R): Human want is the desire, aspiration and motives of humans.
a)
Both Assertion (A) and Reason (R) are true, and Reason (R) is the correct explanation of Assertion (A).
b)
Both Assertion (A) and Reason (R) are true, but Reason (R) is not the correct explanation of Assertion (A).
c)
Assertion (A) is true, but Reason (R) is false .
d)
Assertion (A) is false, but Reason (R) is true.
|
|
Kiran Mehta answered |
All economic problems arises due to unlimited human wants and limited resources. Moreover, these resources have alternative uses and wants keep on increasing each day. This economic problem is also known as the problem of choice or the problem of allocating resources to alternative uses. All the desires and aspirations and motives of humans are known as human wants in economics. And the wants that can be satisfied with goods and services of any kind are economic wants.
Direction: In the following questions, a statement of Assertion (A) is followed by a statement of Reason (R). Mark the correct choice as:Assertion (A): The percentage change in quantity supplied is 20% and the percentage change in price is 20%. Thus the elasticity of supply is 1.Reason (R): The commodity supplied has unitary elastic supply and its supply curve will be upward rising.- a)Both Assertion (A) and Reason (R) are true, and Reason (R) is the correct explanation of the Assertion (A).
- b)Both Assertion (A) and Reason (R) are true, but Reason (R) is not the correct explanation of the Assertion (A).
- c)Assertion (A) is true, but Reason (R) is false.
- d)Assertion (A) is false, but Reason (R) is true.
Correct answer is option 'B'. Can you explain this answer?
Direction: In the following questions, a statement of Assertion (A) is followed by a statement of Reason (R). Mark the correct choice as:
Assertion (A): The percentage change in quantity supplied is 20% and the percentage change in price is 20%. Thus the elasticity of supply is 1.
Reason (R): The commodity supplied has unitary elastic supply and its supply curve will be upward rising.
a)
Both Assertion (A) and Reason (R) are true, and Reason (R) is the correct explanation of the Assertion (A).
b)
Both Assertion (A) and Reason (R) are true, but Reason (R) is not the correct explanation of the Assertion (A).
c)
Assertion (A) is true, but Reason (R) is false.
d)
Assertion (A) is false, but Reason (R) is true.
|
|
Kiran Mehta answered |
The upward shift represents the fact that supply often decreases when the costs of production increase, so producers need to get a higher price than before in order to supply a given quantity of output.
Directions : In the following questions, a statemeAssertion (A): Scatter Diagram method is a graphic expression of the degree and direction or absence of correlation.Reason (R): Scatter Diagram method fails to produce definite trend.- a)Both Assertion (A) and Reason (R) are true, and Reason (R) is the correct explanation of Assertion (A).
- b)Both Assertion (A) and Reason (R) are true, but Reason (R) is not the correct explanation of Assertion (A).
- c)Assertion (A) is true, but Reason (R) is false .
- d)Assertion (A) is false, but Reason (R) is true.
Correct answer is option 'B'. Can you explain this answer?
Directions : In the following questions, a stateme
Assertion (A): Scatter Diagram method is a graphic expression of the degree and direction or absence of correlation.
Reason (R): Scatter Diagram method fails to produce definite trend.
a)
Both Assertion (A) and Reason (R) are true, and Reason (R) is the correct explanation of Assertion (A).
b)
Both Assertion (A) and Reason (R) are true, but Reason (R) is not the correct explanation of Assertion (A).
c)
Assertion (A) is true, but Reason (R) is false .
d)
Assertion (A) is false, but Reason (R) is true.
|
|
Arun Yadav answered |
Scatter diagram offers a graphic expression of the direction and degree of correlation. To construct a scatter diagram, x variables are taken on X-axis and y variable is taken on Y-axis. The cluster of points, plotted, is referred to as a scatter diagram. In this, the degree of closeness of scatter points and their overall direction enables us to examine the relationship.
Directions : In the following questions, a statement of Assertion (A) is followed by a statement of Reason (R). Mark the correct choice as:Assertion (A): 0-10, 10-20, 20-30, 30-40 is an example of Class Intervals.Reason (R): Class Intervals are the value of items shown between two limits in a grouped frequency distribution.- a)Both Assertion (A) and Reason (R) are true, and Reason (R) is the correct explanation of Assertion (A).
- b)Both Assertion (A) and Reason (R) are true, but Reason (R) is not the correct explanation of Assertion (A).
- c)Assertion (A) is true, but Reason (R) is false .
- d)Assertion (A) is false, but Reason (R) is true.
Correct answer is option 'B'. Can you explain this answer?
Directions : In the following questions, a statement of Assertion (A) is followed by a statement of Reason (R). Mark the correct choice as:
Assertion (A): 0-10, 10-20, 20-30, 30-40 is an example of Class Intervals.
Reason (R): Class Intervals are the value of items shown between two limits in a grouped frequency distribution.
a)
Both Assertion (A) and Reason (R) are true, and Reason (R) is the correct explanation of Assertion (A).
b)
Both Assertion (A) and Reason (R) are true, but Reason (R) is not the correct explanation of Assertion (A).
c)
Assertion (A) is true, but Reason (R) is false .
d)
Assertion (A) is false, but Reason (R) is true.

|
Rajdeep Saini answered |
Assertion and Reasoning in Class Intervals
Explanation:
Assertion (A): 0-10, 10-20, 20-30, 30-40 is an example of Class Intervals.
Reason (R): Class Intervals are the value of items shown between two limits in a grouped frequency distribution.
The statement A is true as the given values 0-10, 10-20, 20-30, 30-40 are the examples of Class Intervals. Class interval means the range or group of values in which the data is divided. In statistical analysis, it is essential to group the data to avoid the complexity of handling large data.
The statement R is also true as Class Intervals are the values of items shown between two limits in a grouped frequency distribution. A frequency distribution table is a table that shows the frequency of values in a dataset. The frequency of values is calculated by grouping the data into intervals or classes. The classes have to be continuous, non-overlapping, and exhaustive.
Therefore, both assertion (A) and reasoning (R) are true. However, the reasoning is not the correct explanation of the assertion. The reason describes Class Intervals, but it does not explain why 0-10, 10-20, 20-30, 30-40 are examples of Class Intervals. Hence option B is the correct answer.
Direction: In the following questions, a statement of Assertion (A) is followed by a statement of Reason (R). Mark the correct choice as:Assertion (A): Scatter Diagram method is a graphic expression of the degree and direction or absence of correlation.Reason (R): Scatter Diagram method fails to produce definite trend.- a)Both Assertion (A) and Reason (R) are true, and Reason (R) is the correct explanation of the Assertion (A).
- b)Both Assertion (A) and Reason (R) are true, but Reason (R) is not the correct explanation of the Assertion (A).
- c)Assertion (A) is true, but Reason (R) is false.
- d)Assertion (A) is false, but Reason (R) is true.
Correct answer is option 'B'. Can you explain this answer?
Direction: In the following questions, a statement of Assertion (A) is followed by a statement of Reason (R). Mark the correct choice as:
Assertion (A): Scatter Diagram method is a graphic expression of the degree and direction or absence of correlation.
Reason (R): Scatter Diagram method fails to produce definite trend.
a)
Both Assertion (A) and Reason (R) are true, and Reason (R) is the correct explanation of the Assertion (A).
b)
Both Assertion (A) and Reason (R) are true, but Reason (R) is not the correct explanation of the Assertion (A).
c)
Assertion (A) is true, but Reason (R) is false.
d)
Assertion (A) is false, but Reason (R) is true.
|
|
Priyanka Khatri answered |
Scatter diagram offers a graphic expression of the direction and degree of correlation. To construct a scatter diagram, x variables taken on X-axis and y variable is taken on Y-axis. It gives a precise numerical value of the degree of linear relationship between two variables.
Direction: In the following questions, a statement of Assertion (A) is followed by a statement of Reason (R). Mark the correct choice as:Assertion (A): There is no restriction on the entry and exit of the firms in the perfect competitive market.Reason (R): The perfect competition market is characterised by the sellers being a price taker and not a price maker.- a)Both Assertion (A) and Reason (R) are true, and Reason (R) is the correct explanation of the Assertion (A).
- b)Both Assertion (A) and Reason (R) are true, but Reason (R) is not the correct explanation of the Assertion (A).
- c)Assertion (A) is true, but Reason (R) is false.
- d)Assertion (A) is false, but Reason (R) is true.
Correct answer is option 'B'. Can you explain this answer?
Direction: In the following questions, a statement of Assertion (A) is followed by a statement of Reason (R). Mark the correct choice as:
Assertion (A): There is no restriction on the entry and exit of the firms in the perfect competitive market.
Reason (R): The perfect competition market is characterised by the sellers being a price taker and not a price maker.
a)
Both Assertion (A) and Reason (R) are true, and Reason (R) is the correct explanation of the Assertion (A).
b)
Both Assertion (A) and Reason (R) are true, but Reason (R) is not the correct explanation of the Assertion (A).
c)
Assertion (A) is true, but Reason (R) is false.
d)
Assertion (A) is false, but Reason (R) is true.

|
Maitri Sharma answered |
Assertion (A): There is no restriction on the entry and exit of the firms in the perfect competitive market.
Reason (R): The perfect competition market is characterized by the sellers being a price taker and not a price maker.
The correct answer is option 'B' - Both Assertion (A) and Reason (R) are true, but Reason (R) is not the correct explanation of the Assertion (A).
Explanation:
Perfect competition is a market structure where there are many buyers and sellers, and no individual firm has control over the market price. In this type of market, there are no restrictions on the entry and exit of firms. Let's examine each statement in detail:
Assertion (A): There is no restriction on the entry and exit of the firms in the perfect competitive market.
In a perfectly competitive market, new firms are free to enter the market if they believe they can earn profits. Similarly, existing firms are free to exit the market if they are incurring losses. There are no legal or regulatory barriers that prevent firms from entering or exiting the market. This is because perfect competition promotes competition and allows for efficient allocation of resources.
Reason (R): The perfect competition market is characterized by the sellers being a price taker and not a price maker.
In a perfectly competitive market, each firm is a price taker, meaning they have no control over the market price. The market price is determined by the overall supply and demand in the market. Individual firms have to accept the prevailing market price and adjust their quantity of production accordingly. They cannot influence the market price by changing their output. This is because there are many buyers and sellers in the market, and no individual firm has enough market power to affect the market price.
Explanation of the Correct Answer:
Both Assertion (A) and Reason (R) are true. In a perfectly competitive market, there are no restrictions on the entry and exit of firms, and sellers are price takers. However, Reason (R) does not provide a direct explanation for Assertion (A). The fact that sellers are price takers does not necessarily imply that there are no restrictions on entry and exit. Therefore, option 'B' is the correct answer.
Reason (R): The perfect competition market is characterized by the sellers being a price taker and not a price maker.
The correct answer is option 'B' - Both Assertion (A) and Reason (R) are true, but Reason (R) is not the correct explanation of the Assertion (A).
Explanation:
Perfect competition is a market structure where there are many buyers and sellers, and no individual firm has control over the market price. In this type of market, there are no restrictions on the entry and exit of firms. Let's examine each statement in detail:
Assertion (A): There is no restriction on the entry and exit of the firms in the perfect competitive market.
In a perfectly competitive market, new firms are free to enter the market if they believe they can earn profits. Similarly, existing firms are free to exit the market if they are incurring losses. There are no legal or regulatory barriers that prevent firms from entering or exiting the market. This is because perfect competition promotes competition and allows for efficient allocation of resources.
Reason (R): The perfect competition market is characterized by the sellers being a price taker and not a price maker.
In a perfectly competitive market, each firm is a price taker, meaning they have no control over the market price. The market price is determined by the overall supply and demand in the market. Individual firms have to accept the prevailing market price and adjust their quantity of production accordingly. They cannot influence the market price by changing their output. This is because there are many buyers and sellers in the market, and no individual firm has enough market power to affect the market price.
Explanation of the Correct Answer:
Both Assertion (A) and Reason (R) are true. In a perfectly competitive market, there are no restrictions on the entry and exit of firms, and sellers are price takers. However, Reason (R) does not provide a direct explanation for Assertion (A). The fact that sellers are price takers does not necessarily imply that there are no restrictions on entry and exit. Therefore, option 'B' is the correct answer.
Direction: Read the following passage and answer the question that follows:Agriculture provides livelihood to almost three fourth of population of India. Indian agriculture is highly dependent on spatial and temporal distribution of rainfall. Climate extremes such as drought and flood affect agriculture severely. An account of impact of climate extremes viz. drought and flood, on Indian food-grain production has been presented in this paper. There are temporal fluctuations in food grain production and area under the food-grain. In secular terms, both of them increased up to mid-eighties.After mid-eighties there is decline in the area of food grain while maintaining an increase in production of food-grain suggesting the improvement in agricultural technology and policy. There is more temporal fluctuation in the production of food grain than the area under food grain. The analysis reveals that impact of drought on Indian agriculture is more than that of flood. Rabi food grain production depicts better adaptability to drought than Kharif food grain production mostly due to better access to irrigation infrastructure. Among the various food crops analysed all except jowar can effectively face flood events. Wheat and jowar perform relatively better during drought events.Rice is most sensitive crop to the extreme climate events. Since rice is staple food in the sub-continent, management of rice productions against climate extremes needs special attention for food security and sustainability.Q. What other things affect the supply of goods?- a)Price of the commodity
- b)Income of the consumers
- c)Substitute goods price change
- d)All of the above
Correct answer is option 'D'. Can you explain this answer?
Direction: Read the following passage and answer the question that follows:
Agriculture provides livelihood to almost three fourth of population of India. Indian agriculture is highly dependent on spatial and temporal distribution of rainfall. Climate extremes such as drought and flood affect agriculture severely. An account of impact of climate extremes viz. drought and flood, on Indian food-grain production has been presented in this paper. There are temporal fluctuations in food grain production and area under the food-grain. In secular terms, both of them increased up to mid-eighties.
After mid-eighties there is decline in the area of food grain while maintaining an increase in production of food-grain suggesting the improvement in agricultural technology and policy. There is more temporal fluctuation in the production of food grain than the area under food grain. The analysis reveals that impact of drought on Indian agriculture is more than that of flood. Rabi food grain production depicts better adaptability to drought than Kharif food grain production mostly due to better access to irrigation infrastructure. Among the various food crops analysed all except jowar can effectively face flood events. Wheat and jowar perform relatively better during drought events.
Rice is most sensitive crop to the extreme climate events. Since rice is staple food in the sub-continent, management of rice productions against climate extremes needs special attention for food security and sustainability.
Q. What other things affect the supply of goods?
a)
Price of the commodity
b)
Income of the consumers
c)
Substitute goods price change
d)
All of the above
|
|
Arun Yadav answered |
Factors affecting Supply: Supply refers to the quantity of a good that the producer plans to sell in the market. Supply will be determined by factors such as price, the number of suppliers, the state of technology, government subsidies, weather conditions and the availability of workers to produce the good.
Read the following passage and answer the questions that follows:In economics, rationing is an artificial restriction of demand and is done to keep price below the equilibrium (market-clearing) price determined by the process of supply and demand in an unfettered market. Thus, rationing can be complementary to price controls which can be explained through indifference curve approach.There are two kinds of rationing done by the government to reduce consumption—price rationing and non-price rationing. By rationing, we mean exercise tax and by non-price rationing, we mean all types of control on the quantity consumed. Non-price rationing could be done by giving away coupons that would enable low income families to obtain some goods at affordable prices, which could not be possible if the prices were to increase alone. With coupon schemes, it would develop a black market for coupons, which would paradoxically increase the utility for those who are in need of that commodity by collection of more of these coupons from those who are not in need. This ensures greater marginal utility for those people who are in need of the commodity and will provide exchange of money to those who sell these coupons. For this, it is necessary for the government to encourage trading of the coupons.The major importance of introducing rationing is to keep the price of important commodities under control, as for a necessary commodity, there will be an excessive demand in the market which will drive their price up in the market and high prices leads to reduction of consumption and utility for those who could not afford it. This ensures that the resources are planned in favour of the poor people of the country and restricts the rich people to ensure excessive purchase of limited resources of the country. This ensures development and equality of welfare and utilitybetween the rich and the poor people. Rationing of the good is done by the government and not the private sector. There is the same limit put on every person on the budget spending to which people could buy the commodities and within the limit, one could buy any amount of the commodity.Q. The marginal utility derived from a commodity keeps on ..................... .- a)increasing
- b)decreasing
- c)All of above
- d)None of these
Correct answer is option 'B'. Can you explain this answer?
Read the following passage and answer the questions that follows:
In economics, rationing is an artificial restriction of demand and is done to keep price below the equilibrium (market-clearing) price determined by the process of supply and demand in an unfettered market. Thus, rationing can be complementary to price controls which can be explained through indifference curve approach.
There are two kinds of rationing done by the government to reduce consumption—price rationing and non-price rationing. By rationing, we mean exercise tax and by non-price rationing, we mean all types of control on the quantity consumed. Non-price rationing could be done by giving away coupons that would enable low income families to obtain some goods at affordable prices, which could not be possible if the prices were to increase alone. With coupon schemes, it would develop a black market for coupons, which would paradoxically increase the utility for those who are in need of that commodity by collection of more of these coupons from those who are not in need. This ensures greater marginal utility for those people who are in need of the commodity and will provide exchange of money to those who sell these coupons. For this, it is necessary for the government to encourage trading of the coupons.
The major importance of introducing rationing is to keep the price of important commodities under control, as for a necessary commodity, there will be an excessive demand in the market which will drive their price up in the market and high prices leads to reduction of consumption and utility for those who could not afford it. This ensures that the resources are planned in favour of the poor people of the country and restricts the rich people to ensure excessive purchase of limited resources of the country. This ensures development and equality of welfare and utility
between the rich and the poor people. Rationing of the good is done by the government and not the private sector. There is the same limit put on every person on the budget spending to which people could buy the commodities and within the limit, one could buy any amount of the commodity.
Q. The marginal utility derived from a commodity keeps on ..................... .
a)
increasing
b)
decreasing
c)
All of above
d)
None of these
|
|
Neha Sharma answered |
The marginal utility derived from a commodity keeps on decreasing.
Directions : In the following questions, a statement of Assertion (A) is followed by a statement of Reason (R). Mark the correct choice as:Assertion (A): Marginal Utility diminishes as the person consumes more unit of a commodity.Reason (R): Utility derived from each unit of a commodity is less than that of the previous one.- a)Both Assertion (A) and Reason (R) are true, and Reason (R) is the correct explanation of Assertion (A).
- b)Both Assertion (A) and Reason (R) are true, but Reason (R) is not the correct explanation of Assertion (A).
- c)Assertion (A) is true, but Reason (R) is false .
- d)Assertion (A) is false, but Reason (R) is true.
Correct answer is option 'A'. Can you explain this answer?
Directions : In the following questions, a statement of Assertion (A) is followed by a statement of Reason (R). Mark the correct choice as:
Assertion (A): Marginal Utility diminishes as the person consumes more unit of a commodity.
Reason (R): Utility derived from each unit of a commodity is less than that of the previous one.
a)
Both Assertion (A) and Reason (R) are true, and Reason (R) is the correct explanation of Assertion (A).
b)
Both Assertion (A) and Reason (R) are true, but Reason (R) is not the correct explanation of Assertion (A).
c)
Assertion (A) is true, but Reason (R) is false .
d)
Assertion (A) is false, but Reason (R) is true.
|
|
Vikas Kapoor answered |
The Law Of Diminishing Marginal Utility states that, all else equal, as consumption increases, the marginal utility derived from each additional unit declines. Marginal utility is derived as the change in utility as an additional unit is consumed. Utility is an economic term used to represent satisfaction or happiness. Marginal utility is the incremental increase in utility that results from consumption of one additional unit.
Directions : In the following questions, a statement of Assertion (A) is followed by a statement of Reason (R). Mark the correct choice as:Assertion (A): Bar graph is represented with the help of bars or rectangles.Reason (R): Bar graphs can represent the data of single series and multiple series.- a)Both Assertion (A) and Reason (R) are true, and Reason (R) is the correct explanation of Assertion (A).
- b)Both Assertion (A) and Reason (R) are true, but Reason (R) is not the correct explanation of Assertion (A).
- c)Assertion (A) is true, but Reason (R) is false .
- d)Assertion (A) is false, but Reason (R) is true.
Correct answer is option 'B'. Can you explain this answer?
Directions : In the following questions, a statement of Assertion (A) is followed by a statement of Reason (R). Mark the correct choice as:
Assertion (A): Bar graph is represented with the help of bars or rectangles.
Reason (R): Bar graphs can represent the data of single series and multiple series.
a)
Both Assertion (A) and Reason (R) are true, and Reason (R) is the correct explanation of Assertion (A).
b)
Both Assertion (A) and Reason (R) are true, but Reason (R) is not the correct explanation of Assertion (A).
c)
Assertion (A) is true, but Reason (R) is false .
d)
Assertion (A) is false, but Reason (R) is true.
|
|
Amit Kumar answered |
A bar graph is a specific way of representing data using rectangular bars where the length of each bar is proportional to the value they represent. It is basically a graphical representation of data using bars of different heights.
Directions : In the following questions, a statement of Assertion (A) is followed by a statement of Reason (R). Mark the correct choice as:Assertion (A): When inclusive series is given, it needs to be changed into exclusive series.Reason (R): It is easy to calculate using exclusive series.- a)Both Assertion (A) and Reason (R) are true, and Reason (R) is the correct explanation of Assertion (A).
- b)Both Assertion (A) and Reason (R) are true, but Reason (R) is not the correct explanation of Assertion (A).
- c)Assertion (A) is true, but Reason (R) is false .
- d)Assertion (A) is false, but Reason (R) is true.
Correct answer is option 'B'. Can you explain this answer?
Directions : In the following questions, a statement of Assertion (A) is followed by a statement of Reason (R). Mark the correct choice as:
Assertion (A): When inclusive series is given, it needs to be changed into exclusive series.
Reason (R): It is easy to calculate using exclusive series.
a)
Both Assertion (A) and Reason (R) are true, and Reason (R) is the correct explanation of Assertion (A).
b)
Both Assertion (A) and Reason (R) are true, but Reason (R) is not the correct explanation of Assertion (A).
c)
Assertion (A) is true, but Reason (R) is false .
d)
Assertion (A) is false, but Reason (R) is true.

|
Bhargavi Banerjee answered |
Assertion and Reasoning: Inclusive and Exclusive Series
Assertion (A): When inclusive series is given, it needs to be changed into exclusive series.
Reason (R): It is easy to calculate using exclusive series.
Explanation:
In statistics, the data is usually represented in the form of a series. A series is a set of observations arranged in a particular order. There are two types of series - inclusive series and exclusive series.
An inclusive series includes the upper limit of each class interval, whereas an exclusive series does not include the upper limit of each class interval. For example, if the class interval is 0-10, an inclusive series would include 10 in that interval, whereas an exclusive series would not.
Assertion (A) is true because it is easier to calculate using an exclusive series. This is because the upper limit of each class interval is not included in an exclusive series. Therefore, the midpoint of each class interval can be used as the representative value of that interval. This makes calculations simpler and more accurate.
Reason (R) is also true because it is easier to calculate using an exclusive series. However, it is not the correct explanation of Assertion (A). The correct explanation of Assertion (A) is that exclusive series is preferred because it is easier to calculate.
Therefore, the correct answer is option (B) - Both Assertion (A) and Reason (R) are true, but Reason (R) is not the correct explanation of Assertion (A).
Directions : In the following questions, a statement of Assertion (A) is followed by a statement of Reason (R). Mark the correct choice as:Assertion (A): A good questionnaire helps in the collection of Primary Data.Reason (R): Primary Data is the first hand data collection.- a)Both Assertion (A) and Reason (R) are true, and Reason (R) is the correct explanation of Assertion (A).
- b)Both Assertion (A) and Reason (R) are true, but Reason (R) is not the correct explanation of Assertion (A).
- c)Assertion (A) is true, but Reason (R) is false .
- d)Assertion (A) is false, but Reason (R) is true.
Correct answer is option 'B'. Can you explain this answer?
Directions : In the following questions, a statement of Assertion (A) is followed by a statement of Reason (R). Mark the correct choice as:
Assertion (A): A good questionnaire helps in the collection of Primary Data.
Reason (R): Primary Data is the first hand data collection.
a)
Both Assertion (A) and Reason (R) are true, and Reason (R) is the correct explanation of Assertion (A).
b)
Both Assertion (A) and Reason (R) are true, but Reason (R) is not the correct explanation of Assertion (A).
c)
Assertion (A) is true, but Reason (R) is false .
d)
Assertion (A) is false, but Reason (R) is true.
|
|
Naina Sharma answered |
Primary data is the collection of data collected by the investigator for his own purpose for the first time. These are collected from the source of origin.
The questionnaire is a structured technique for collecting primary data in a marketing survey. It is a series of written or verbal questions for which the respondent provides answers. A well-designed questionnaire motivates the respondent to provide complete and accurate information. Structured questionary is usually associated with quantitative research A structured questionnaire, on the other hand, is one in which the questions asked are precisely decided in advance.
Directions : In the following questions, a statement of Assertion (A) is followed by a statement of Reason (R). Mark the correct choice as:Assertion (A): The basic problem of for whom to produce can be solved with the help of the needs and desire of the humans.Reason (R): There are three basic problems in an economy, namely, what to produce, how to produce and for whom to produce.- a)Both Assertion (A) and Reason (R) are true, and Reason (R) is the correct explanation of Assertion (A).
- b)Both Assertion (A) and Reason (R) are true, but Reason (R) is not the correct explanation of Assertion (A).
- c)Assertion (A) is true, but Reason (R) is false .
- d)Assertion (A) is false, but Reason (R) is true.
Correct answer is option 'B'. Can you explain this answer?
Directions : In the following questions, a statement of Assertion (A) is followed by a statement of Reason (R). Mark the correct choice as:
Assertion (A): The basic problem of for whom to produce can be solved with the help of the needs and desire of the humans.
Reason (R): There are three basic problems in an economy, namely, what to produce, how to produce and for whom to produce.
a)
Both Assertion (A) and Reason (R) are true, and Reason (R) is the correct explanation of Assertion (A).
b)
Both Assertion (A) and Reason (R) are true, but Reason (R) is not the correct explanation of Assertion (A).
c)
Assertion (A) is true, but Reason (R) is false .
d)
Assertion (A) is false, but Reason (R) is true.
|
|
Vikas Kapoor answered |
The three basic economic problems are regarding the allocation of the resources. These are what to produce, how to produce, and for whom to produce.
Directions : In the following questions, a statement of Assertion (A) is followed by a statement of Reason (R). Mark the correct choice as:Assertion (A): Frequency Polygon cannot be created without plotting a Histogram.Reason (R): Frequency Polygon is made by joining the mid-points with straight lines.- a)Both Assertion (A) and Reason (R) are true, and Reason (R) is the correct explanation of Assertion (A).
- b)Both Assertion (A) and Reason (R) are true, but Reason (R) is not the correct explanation of Assertion (A).
- c)Assertion (A) is true, but Reason (R) is false .
- d)Assertion (A) is false, but Reason (R) is true.
Correct answer is option 'D'. Can you explain this answer?
Directions : In the following questions, a statement of Assertion (A) is followed by a statement of Reason (R). Mark the correct choice as:
Assertion (A): Frequency Polygon cannot be created without plotting a Histogram.
Reason (R): Frequency Polygon is made by joining the mid-points with straight lines.
a)
Both Assertion (A) and Reason (R) are true, and Reason (R) is the correct explanation of Assertion (A).
b)
Both Assertion (A) and Reason (R) are true, but Reason (R) is not the correct explanation of Assertion (A).
c)
Assertion (A) is true, but Reason (R) is false .
d)
Assertion (A) is false, but Reason (R) is true.
|
|
Aryan Khanna answered |
A frequency polygon can be created from the histogram or by calculating the midpoints of the bins from the frequency distribution table. The midpoint of a bin is calculated by adding the upper and lower boundary values of the bin and dividing the sum by 2.
Identify the correct pair of items from the following Columns I and II: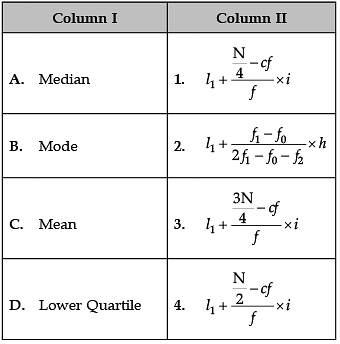
- a)A–1
- b)B–2
- c)C–3
- d)D–4
Correct answer is option 'B'. Can you explain this answer?
Identify the correct pair of items from the following Columns I and II:
a)
A–1
b)
B–2
c)
C–3
d)
D–4
|
|
Amita Das answered |
Correct formulas are:
A. Median: 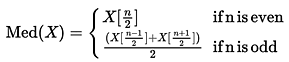
B. Mode: 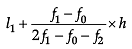
C. Mean: 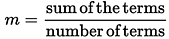
D. Lower Quartile: (N + 1) * 1 / 4
Direction: In the following questions, a statement of Assertion (A) is followed by a statement of Reason (R). Mark the correct choice as:Assertion (A): Elasticity of supply of gold is unitary elastic.Reason (R): The unitary elastic supply is equal to 1.- a)Both Assertion (A) and Reason (R) are true, and Reason (R) is the correct explanation of the Assertion (A).
- b)Both Assertion (A) and Reason (R) are true, but Reason (R) is not the correct explanation of the Assertion (A).
- c)Assertion (A) is true, but Reason (R) is false.
- d)Assertion (A) is false, but Reason (R) is true.
Correct answer is option 'C'. Can you explain this answer?
Direction: In the following questions, a statement of Assertion (A) is followed by a statement of Reason (R). Mark the correct choice as:
Assertion (A): Elasticity of supply of gold is unitary elastic.
Reason (R): The unitary elastic supply is equal to 1.
a)
Both Assertion (A) and Reason (R) are true, and Reason (R) is the correct explanation of the Assertion (A).
b)
Both Assertion (A) and Reason (R) are true, but Reason (R) is not the correct explanation of the Assertion (A).
c)
Assertion (A) is true, but Reason (R) is false.
d)
Assertion (A) is false, but Reason (R) is true.
|
|
Amita Das answered |
Unit Elastic Supply has a PES of 1, where quantity supplied change by the same percentage as the price change.
Identify the correct pair of items from the following Columns I and II: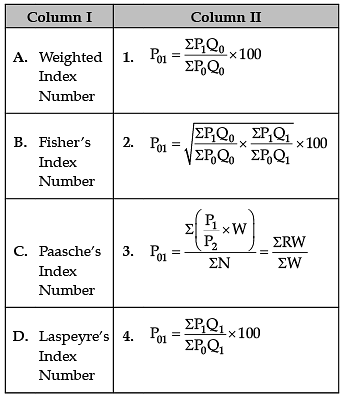
- a)A–1
- b)B–2
- c)C–3
- d)D–4
Correct answer is option 'B'. Can you explain this answer?
Identify the correct pair of items from the following Columns I and II:
a)
A–1
b)
B–2
c)
C–3
d)
D–4
|
|
Anjali Sharma answered |
A. Weighted Index Number:
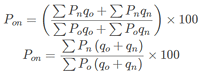
B. Fisher’s Ideal Index Number:
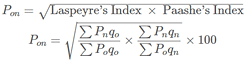
C. Paasche’s Index Number:
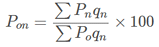
D. Laspeyre’s Index Number:
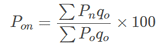
Direction: In the following questions, a statement of Assertion (A) is followed by a statement of Reason (R). Mark the correct choice as:Assertion (A): Index number and Mean are one and the same thing.Reason (R): Mean is the central value of the items present in the series.- a)Both Assertion (A) and Reason (R) are true, and Reason (R) is the correct explanation of the Assertion (A).
- b)Both Assertion (A) and Reason (R) are true, but Reason (R) is not the correct explanation of the Assertion (A).
- c)Assertion (A) is true, but Reason (R) is false.
- d)Assertion (A) is false, but Reason (R) is true.
Correct answer is option 'D'. Can you explain this answer?
Direction: In the following questions, a statement of Assertion (A) is followed by a statement of Reason (R). Mark the correct choice as:
Assertion (A): Index number and Mean are one and the same thing.
Reason (R): Mean is the central value of the items present in the series.
a)
Both Assertion (A) and Reason (R) are true, and Reason (R) is the correct explanation of the Assertion (A).
b)
Both Assertion (A) and Reason (R) are true, but Reason (R) is not the correct explanation of the Assertion (A).
c)
Assertion (A) is true, but Reason (R) is false.
d)
Assertion (A) is false, but Reason (R) is true.
|
|
Amita Das answered |
An index number is the measure of change in a variable (or group of variables) over time. Index numbers are one of the most used statistical tools in economics. Index numbers are not directly measurable, but represent general, relative changes. They are typically expressed as percents. Whereas, Mean is the central value of the items present in the series
Directions : In the following questions, a statement of Assertion (A) is followed by a statement of Reason (R). Mark the correct choice as:Assertion (A): Mode of a series 2, 4, 2, 5, 6, 2, 3, 8, 9, 2, 5, 10 is 2.Reason (R): Mode of a set of observations is that value which occurs the greatest number of times, i.e., with the highest frequency in a series.- a)Both Assertion (A) and Reason (R) are true, and Reason (R) is the correct explanation of Assertion (A).
- b)Both Assertion (A) and Reason (R) are true, but Reason (R) is not the correct explanation of Assertion (A).
- c)Assertion (A) is true, but Reason (R) is false .
- d)Assertion (A) is false, but Reason (R) is true.
Correct answer is option 'A'. Can you explain this answer?
Directions : In the following questions, a statement of Assertion (A) is followed by a statement of Reason (R). Mark the correct choice as:
Assertion (A): Mode of a series 2, 4, 2, 5, 6, 2, 3, 8, 9, 2, 5, 10 is 2.
Reason (R): Mode of a set of observations is that value which occurs the greatest number of times, i.e., with the highest frequency in a series.
a)
Both Assertion (A) and Reason (R) are true, and Reason (R) is the correct explanation of Assertion (A).
b)
Both Assertion (A) and Reason (R) are true, but Reason (R) is not the correct explanation of Assertion (A).
c)
Assertion (A) is true, but Reason (R) is false .
d)
Assertion (A) is false, but Reason (R) is true.
|
|
Naina Sharma answered |
Any observation occurring maximum number of times or most frequently in a series is the mode of that series. Thus, we can say that the mode is the item having the highest frequency. The most frequently occurring observation in a data set is called Mode (also known as modal value). This is a measure of the tendency of the data values.
Direction: In the following questions, a statement of Assertion (A) is followed by a statement of Reason (R). Mark the correct choice as:Assertion (A): In oligopoly market, the firms restrict the entry of new firms.Reason (R): Oligopoly market has few sellers which influence the decisions of the market and restrict the entry of new firms.- a)Both Assertion (A) and Reason (R) are true, and Reason (R) is the correct explanation of the Assertion (A).
- b)Both Assertion (A) and Reason (R) are true, but Reason (R) is not the correct explanation of the Assertion (A).
- c)Assertion (A) is true, but Reason (R) is false.
- d)Assertion (A) is false, but Reason (R) is true.
Correct answer is option 'A'. Can you explain this answer?
Direction: In the following questions, a statement of Assertion (A) is followed by a statement of Reason (R). Mark the correct choice as:
Assertion (A): In oligopoly market, the firms restrict the entry of new firms.
Reason (R): Oligopoly market has few sellers which influence the decisions of the market and restrict the entry of new firms.
a)
Both Assertion (A) and Reason (R) are true, and Reason (R) is the correct explanation of the Assertion (A).
b)
Both Assertion (A) and Reason (R) are true, but Reason (R) is not the correct explanation of the Assertion (A).
c)
Assertion (A) is true, but Reason (R) is false.
d)
Assertion (A) is false, but Reason (R) is true.
|
|
Kiran Mehta answered |
One important source of oligopoly power is barriers to entry. Barriers to entry are obstacles that make it difficult to enter a given market. This means that new firms cannot enter the market whenever existing firms are making a positive economic profit, as is the case in perfect competition.
Directions : In the following questions, a statement of Assertion (A) is followed by a statement of Reason (R). Mark the correct choice as:Assertion (A): Mode is dependent on frequencies.Reason (R): Mode has very little effect on marginal units.- a)Both Assertion (A) and Reason (R) are true, and Reason (R) is the correct explanation of Assertion (A).
- b)Both Assertion (A) and Reason (R) are true, but Reason (R) is not the correct explanation of Assertion (A).
- c)Assertion (A) is true, but Reason (R) is false .
- d)Assertion (A) is false, but Reason (R) is true.
Correct answer is option 'B'. Can you explain this answer?
Directions : In the following questions, a statement of Assertion (A) is followed by a statement of Reason (R). Mark the correct choice as:
Assertion (A): Mode is dependent on frequencies.
Reason (R): Mode has very little effect on marginal units.
a)
Both Assertion (A) and Reason (R) are true, and Reason (R) is the correct explanation of Assertion (A).
b)
Both Assertion (A) and Reason (R) are true, but Reason (R) is not the correct explanation of Assertion (A).
c)
Assertion (A) is true, but Reason (R) is false .
d)
Assertion (A) is false, but Reason (R) is true.

|
Athul Yadav answered |
Assertion (A): Mode is dependent on frequencies.
Reason (R): Mode has very little effect on marginal units.
The correct answer is option 'B', which states that both Assertion (A) and Reason (R) are true, but Reason (R) is not the correct explanation of Assertion (A).
Explanation:
To understand the relationship between mode and frequencies, let's first define what mode is. Mode is a measure of central tendency that represents the most frequently occurring value in a data set. It is the value that appears the highest number of times.
Mode and Frequencies:
- The mode is dependent on frequencies because it is determined by the value with the highest frequency in the data set. In other words, the mode is the value that occurs most frequently.
- The frequency of each value in the data set is essential in determining the mode. The value with the highest frequency becomes the mode.
- If there are multiple values with the same highest frequency, the data set is said to be multimodal, meaning it has multiple modes.
Effect of Mode on Marginal Units:
- The mode does not have a direct effect on marginal units. Marginal units refer to the individual data points or observations at the extremes of the data set.
- The mode represents the most frequently occurring value, but it does not provide information about the marginal units.
- The mode focuses on the central tendency of the data set and does not consider the marginal units or outliers.
Explanation of Answer:
- Both Assertion (A) and Reason (R) are true because the mode is indeed dependent on frequencies, and it represents the value with the highest frequency in a data set.
- However, Reason (R) is not the correct explanation of Assertion (A) because the mode's dependence on frequencies does not directly relate to its effect on marginal units.
- The mode is primarily concerned with identifying the most frequently occurring value and does not provide information about the marginal units or outliers.
Therefore, option 'B' is the correct answer as it correctly identifies that both Assertion (A) and Reason (R) are true, but Reason (R) is not the correct explanation of Assertion (A).
Direction: In the following questions, a statement of Assertion (A) is followed by a statement of Reason (R). Mark the correct choice as:Assertion (A): When the price of the goods falls, the supply curve shifts to the right.Reason (R): When price of the goods falls, the producers sell less as there is a positive relation between price and quantity supplied.- a)Both Assertion (A) and Reason (R) are true, and Reason (R) is the correct explanation of the Assertion (A).
- b)Both Assertion (A) and Reason (R) are true, but Reason (R) is not the correct explanation of the Assertion (A).
- c)Assertion (A) is true, but Reason (R) is false.
- d)Assertion (A) is false, but Reason (R) is true.
Correct answer is option 'C'. Can you explain this answer?
Direction: In the following questions, a statement of Assertion (A) is followed by a statement of Reason (R). Mark the correct choice as:
Assertion (A): When the price of the goods falls, the supply curve shifts to the right.
Reason (R): When price of the goods falls, the producers sell less as there is a positive relation between price and quantity supplied.
a)
Both Assertion (A) and Reason (R) are true, and Reason (R) is the correct explanation of the Assertion (A).
b)
Both Assertion (A) and Reason (R) are true, but Reason (R) is not the correct explanation of the Assertion (A).
c)
Assertion (A) is true, but Reason (R) is false.
d)
Assertion (A) is false, but Reason (R) is true.

|
Vaishnavi Bajaj answered |
Assertion (A): When the price of the goods falls, the supply curve shifts to the right.
Reason (R): When price of the goods falls, the producers sell less as there is a positive relation between price and quantity supplied.
To understand the correct choice between the assertion and reason, let's analyze each statement individually:
Assertion (A): When the price of the goods falls, the supply curve shifts to the right.
The statement is true. According to the law of supply, when the price of goods decreases, producers are less willing to supply the goods at a lower price. Therefore, the quantity supplied decreases. This is represented by a movement along the supply curve, resulting in a leftward shift.
Reason (R): When price of the goods falls, the producers sell less as there is a positive relation between price and quantity supplied.
The statement is false. In reality, there is a positive relationship between price and quantity supplied, which means that as the price increases, producers are willing to supply more goods. Conversely, as the price decreases, producers are willing to supply fewer goods.
Explanation:
The correct choice is option 'C' - Assertion (A) is true, but Reason (R) is false.
The assertion correctly states that when the price of the goods falls, the supply curve shifts to the left. This is because producers are less willing to supply goods at lower prices. As a result, the quantity supplied decreases.
However, the reason incorrectly suggests that producers sell less when the price of goods falls. In reality, when prices decrease, producers sell more goods. This is because they can make a profit even at a lower price due to the positive relationship between price and quantity supplied.
To summarize, while the assertion is true and correctly explains the relationship between price and the supply curve, the reason is false as it incorrectly suggests that producers sell less when the price of goods falls.
Reason (R): When price of the goods falls, the producers sell less as there is a positive relation between price and quantity supplied.
To understand the correct choice between the assertion and reason, let's analyze each statement individually:
Assertion (A): When the price of the goods falls, the supply curve shifts to the right.
The statement is true. According to the law of supply, when the price of goods decreases, producers are less willing to supply the goods at a lower price. Therefore, the quantity supplied decreases. This is represented by a movement along the supply curve, resulting in a leftward shift.
Reason (R): When price of the goods falls, the producers sell less as there is a positive relation between price and quantity supplied.
The statement is false. In reality, there is a positive relationship between price and quantity supplied, which means that as the price increases, producers are willing to supply more goods. Conversely, as the price decreases, producers are willing to supply fewer goods.
Explanation:
The correct choice is option 'C' - Assertion (A) is true, but Reason (R) is false.
The assertion correctly states that when the price of the goods falls, the supply curve shifts to the left. This is because producers are less willing to supply goods at lower prices. As a result, the quantity supplied decreases.
However, the reason incorrectly suggests that producers sell less when the price of goods falls. In reality, when prices decrease, producers sell more goods. This is because they can make a profit even at a lower price due to the positive relationship between price and quantity supplied.
To summarize, while the assertion is true and correctly explains the relationship between price and the supply curve, the reason is false as it incorrectly suggests that producers sell less when the price of goods falls.
Directions : In the following questions, a statement of Assertion (A) is followed by a statement of Reason (R). Mark the correct choice as:Assertion (A): Madan bought two kg of mangoes as it was cheaper. This is an example of Normative Economics.Reason (R): Normative economics examines real economic events from moral and ethical angles and judges whether certain economic events are desirable or not.- a)Both Assertion (A) and Reason (R) are true, and Reason (R) is the correct explanation of Assertion (A).
- b)Both Assertion (A) and Reason (R) are true, but Reason (R) is not the correct explanation of Assertion (A).
- c)Assertion (A) is true, but Reason (R) is false .
- d)Assertion (A) is false, but Reason (R) is true.
Correct answer is option 'D'. Can you explain this answer?
Directions : In the following questions, a statement of Assertion (A) is followed by a statement of Reason (R). Mark the correct choice as:
Assertion (A): Madan bought two kg of mangoes as it was cheaper. This is an example of Normative Economics.
Reason (R): Normative economics examines real economic events from moral and ethical angles and judges whether certain economic events are desirable or not.
a)
Both Assertion (A) and Reason (R) are true, and Reason (R) is the correct explanation of Assertion (A).
b)
Both Assertion (A) and Reason (R) are true, but Reason (R) is not the correct explanation of Assertion (A).
c)
Assertion (A) is true, but Reason (R) is false .
d)
Assertion (A) is false, but Reason (R) is true.
|
|
Kiran Mehta answered |
Normative economics is a perspective on economics that reflects normative, or ideologically prescriptive judgments toward economic development, investment projects, statements, and scenarios.
Direction: In the following questions, a statement of Assertion (A) is followed by a statement of Reason (R). Mark the correct choice as:Assertion (A): A firm is able to sell more quantity of a good only by lowering the price.Reason (R): The firm’s Marginal Revenue, as he goes on selling, would be less than Average revenue.- a)Both Assertion (A) and Reason (R) are true, and Reason (R) is the correct explanation of the Assertion (A).
- b)Both Assertion (A) and Reason (R) are true, but Reason (R) is not the correct explanation of the Assertion (A).
- c)Assertion (A) is true, but Reason (R) is false.
- d)Assertion (A) is false, but Reason (R) is true.
Correct answer is option 'B'. Can you explain this answer?
Direction: In the following questions, a statement of Assertion (A) is followed by a statement of Reason (R). Mark the correct choice as:
Assertion (A): A firm is able to sell more quantity of a good only by lowering the price.
Reason (R): The firm’s Marginal Revenue, as he goes on selling, would be less than Average revenue.
a)
Both Assertion (A) and Reason (R) are true, and Reason (R) is the correct explanation of the Assertion (A).
b)
Both Assertion (A) and Reason (R) are true, but Reason (R) is not the correct explanation of the Assertion (A).
c)
Assertion (A) is true, but Reason (R) is false.
d)
Assertion (A) is false, but Reason (R) is true.
|
|
Arun Yadav answered |
The firm's marginal revenue will be equal to average revenue as marginal revenue is net addition to the revenue when an additional unit is produced.
Directions : In the following questions, a statement of Assertion (A) is followed by a statement of Reason (R). Mark the correct choice as:Assertion (A): In graphical representation accuracy can be checked easily.Reason (R): No mathematical knowledge is required for graphically representing the data.- a)Both Assertion (A) and Reason (R) are true, and Reason (R) is the correct explanation of Assertion (A).
- b)Both Assertion (A) and Reason (R) are true, but Reason (R) is not the correct explanation of Assertion (A).
- c)Assertion (A) is true, but Reason (R) is false .
- d)Assertion (A) is false, but Reason (R) is true.
Correct answer is option 'D'. Can you explain this answer?
Directions : In the following questions, a statement of Assertion (A) is followed by a statement of Reason (R). Mark the correct choice as:
Assertion (A): In graphical representation accuracy can be checked easily.
Reason (R): No mathematical knowledge is required for graphically representing the data.
a)
Both Assertion (A) and Reason (R) are true, and Reason (R) is the correct explanation of Assertion (A).
b)
Both Assertion (A) and Reason (R) are true, but Reason (R) is not the correct explanation of Assertion (A).
c)
Assertion (A) is true, but Reason (R) is false .
d)
Assertion (A) is false, but Reason (R) is true.

|
Jay Chakraborty answered |
Assertion and Reasoning in Graphical Representation
Assertion: In graphical representation accuracy can be checked easily.
Reason: No mathematical knowledge is required for graphically representing the data.
The correct answer is option D, i.e., Assertion (A) is false, but Reason (R) is true.
Explanation:
Graphical representation is a visual representation of data that makes it easier for the viewer to understand the data. It is a clear and concise way of presenting large amounts of information in an easy-to-understand format. However, graphical representation does not guarantee accuracy. It is possible to create misleading graphs if the data is not presented correctly.
In order to create an accurate graph, one needs to have a good understanding of the data being presented. This requires mathematical knowledge to ensure that the graph is correctly scaled and labeled. Without mathematical knowledge, it is possible to create a graph that is misleading or inaccurate.
However, once a graph has been created, it is generally easy to check its accuracy. This is because the data is presented visually, which makes it easy to spot any errors or inconsistencies. In addition, many software programs have built-in tools that allow users to check the accuracy of their graphs.
In conclusion, graphical representation is a useful tool for presenting data in a clear and concise format. However, it is important to have mathematical knowledge to ensure that the data is accurately represented. Once a graph has been created, it is generally easy to check its accuracy visually.
Directions : In the following questions, a statement of Assertion (A) is followed by a statement of Reason (R). Mark the correct choice as:Assertion (A): Ogives can only be made with less than cumulative frequency distribution.Reason (R): Ogive is a frequency distribution graph by plotting cumulative frequency distribution in a form of smooth curve.- a)Both Assertion (A) and Reason (R) are true, and Reason (R) is the correct explanation of Assertion (A).
- b)Both Assertion (A) and Reason (R) are true, but Reason (R) is not the correct explanation of Assertion (A).
- c)Assertion (A) is true, but Reason (R) is false .
- d)Assertion (A) is false, but Reason (R) is true.
Correct answer is option 'D'. Can you explain this answer?
Directions : In the following questions, a statement of Assertion (A) is followed by a statement of Reason (R). Mark the correct choice as:
Assertion (A): Ogives can only be made with less than cumulative frequency distribution.
Reason (R): Ogive is a frequency distribution graph by plotting cumulative frequency distribution in a form of smooth curve.
a)
Both Assertion (A) and Reason (R) are true, and Reason (R) is the correct explanation of Assertion (A).
b)
Both Assertion (A) and Reason (R) are true, but Reason (R) is not the correct explanation of Assertion (A).
c)
Assertion (A) is true, but Reason (R) is false .
d)
Assertion (A) is false, but Reason (R) is true.

|
Arshiya Datta answered |
Assertion (A): Ogives can only be made with less than cumulative frequency distribution.
Reason (R): Ogive is a frequency distribution graph by plotting cumulative frequency distribution in the form of a smooth curve.
Explanation:
An ogive is a graph that represents the cumulative frequency distribution of a dataset. It is used to show the cumulative frequency of a dataset up to a certain point. The ogive is created by plotting points on a graph, where the x-axis represents the upper class boundaries of the data and the y-axis represents the cumulative frequency.
Understanding the Assertion (A):
The assertion states that ogives can only be made with less than cumulative frequency distribution. This means that the ogive graph can only be created using the less than type of cumulative frequency distribution.
Understanding the Reason (R):
The reason states that the ogive is a frequency distribution graph that plots the cumulative frequency distribution in the form of a smooth curve. This means that the ogive represents the cumulative frequencies in a graphical form.
Explanation of the Correct Answer:
The correct answer is option 'D', which states that Assertion (A) is false, but Reason (R) is true.
The reason for this is that ogives can be created using both less than and more than type of cumulative frequency distribution. In the less than type, the ogive is plotted by considering the upper class boundaries and the cumulative frequencies up to each class. In the more than type, the ogive is plotted by considering the lower class boundaries and the cumulative frequencies from each class onwards.
Conclusion:
In conclusion, ogives can be made with both less than and more than cumulative frequency distributions. The assertion that ogives can only be made with less than cumulative frequency distribution is false. However, the reason that ogives represent the cumulative frequency distribution in the form of a smooth curve is true.
Chapter doubts & questions for CBSE Practice Questions - Economics Class 11 2024 is part of Commerce exam preparation. The chapters have been prepared according to the Commerce exam syllabus. The Chapter doubts & questions, notes, tests & MCQs are made for Commerce 2024 Exam. Find important definitions, questions, notes, meanings, examples, exercises, MCQs and online tests here.
Chapter doubts & questions of CBSE Practice Questions - Economics Class 11 in English & Hindi are available as part of Commerce exam.
Download more important topics, notes, lectures and mock test series for Commerce Exam by signing up for free.
Economics Class 11
75 videos|274 docs|46 tests
|
Signup to see your scores go up within 7 days!
Study with 1000+ FREE Docs, Videos & Tests
10M+ students study on EduRev
|
© EduRev
|
Education Revolution
|


Follow Us
|


Signup to see your scores
go up within 7 days!
Access 1000+ FREE Docs, Videos and Tests
Takes less than 10 seconds to signup