


All Exams >
Grade 8 >
Mathematics for Grade 8 >
All Questions
All questions of Graphs and Relations for Grade 8 Exam

| 1 Crore+ students have signed up on EduRev. Have you? Download the App |
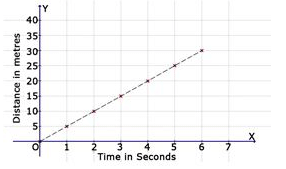
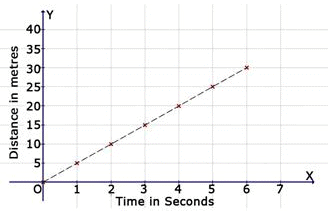
Find the distance covered in 2 seconds. 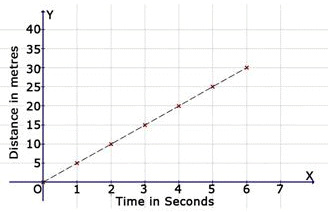
- a)15 m
- b)20 m
- c)25 m
- d)10m
Correct answer is option 'D'. Can you explain this answer?
Find the distance covered in 2 seconds.
a)
15 m
b)
20 m
c)
25 m
d)
10m

|
Sneha Singh answered |
10m is the correct answer because in the graph at 2 seconds, the line is on 10m.
In which quadrant does the point Q (-2, -6) lie?- a)I
- b)II
- c)IV
- d)III
Correct answer is option 'D'. Can you explain this answer?
In which quadrant does the point Q (-2, -6) lie?
a)
I
b)
II
c)
IV
d)
III
|
|
Shubham Sharma answered |
The third quadrant is the quadrant where x and y are negative. Hence (-2,-6) lie in 3rd quadrant
On which axis does the point (0, 5) lie?- a)x-axis
- b)origin
- c)y-axis
- d)None of these
Correct answer is option 'C'. Can you explain this answer?
On which axis does the point (0, 5) lie?
a)
x-axis
b)
origin
c)
y-axis
d)
None of these
|
|
Shubham Sharma answered |
There are no units for x-coordinate and 5 units of y- coordinate . So the point lies on the y-axis.
Find the coordinates of the point B from the graph. 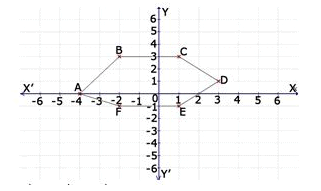
- a)(-2, 3)
- b)(0, -4)
- c)(-4, 5)
- d)none of these
Correct answer is option 'A'. Can you explain this answer?
Find the coordinates of the point B from the graph.
a)
(-2, 3)
b)
(0, -4)
c)
(-4, 5)
d)
none of these
|
|
Ananya Das answered |
The point is -2 units from x-coordinate and 3 units from y coordinate, hence the coordinates of the point is (-2,3).
In which quadrant does the point P (-5, -1) lie?- a)First quadrant
- b) Second Quadrant
- c)Third Quadrant
- d)Fourth quadrant
Correct answer is option 'C'. Can you explain this answer?
In which quadrant does the point P (-5, -1) lie?
a)
First quadrant
b)
Second Quadrant
c)
Third Quadrant
d)
Fourth quadrant
|
|
Ananya Das answered |
In first quadrant we have (+,+) in second quadrant we have (-,+) in third quadrant we have (-,-) and in 4quadrant we have (+,-)so (-5,-1)lies in 3rd quadrant.
(o, y) are the co-ordinates of a point lying on which of the following?- a)origin
- b)y-axis
- c)x-axis
- d)none of these.
Correct answer is option 'B'. Can you explain this answer?
(o, y) are the co-ordinates of a point lying on which of the following?
a)
origin
b)
y-axis
c)
x-axis
d)
none of these.
|
|
Meera Kumar answered |
As we don’t have any units for x-coordinate the ,so the point lies on the y-axis.
On which axis does the point (0, 5) lie?- a)origin
- b)x-axis
- c)y-axis
- d)None of these
Correct answer is option 'C'. Can you explain this answer?
On which axis does the point (0, 5) lie?
a)
origin
b)
x-axis
c)
y-axis
d)
None of these
|
|
Rajesh Basu answered |
ANSWER :- c
Solution :- The point (0,5) lies on Y- axis.
Hence, x=0, y=5
Find the coordinates of the point D from the graph. 
- a) (0, -4)
- b) (-4, 5)
- c) (3, 1)
- d) None of these
Correct answer is option 'C'. Can you explain this answer?
Find the coordinates of the point D from the graph.
a)
(0, -4)
b)
(-4, 5)
c)
(3, 1)
d)
None of these

|
Avneet Aulakh answered |
That is because coordinations are written like this:(x,y)That means that the X value will come first because it is independent value and after that the Y value will come because it is a dependent value.
Find the coordinates of the point C from the graph. 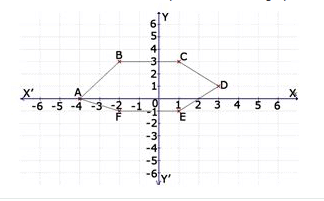
- a)(1, 3)
- b)(-4, 5)
- c)(0, -4)
- d)None of these
Correct answer is option 'A'. Can you explain this answer?
Find the coordinates of the point C from the graph.
a)
(1, 3)
b)
(-4, 5)
c)
(0, -4)
d)
None of these
|
|
Pooja Shah answered |
As x-coordinate is 1 unit and y-coordinate is 3 units.
Find the distance covered in 5 seconds. 
- a)25 m
- b)10 m
- c)20 m
- d)none of these
Correct answer is option 'A'. Can you explain this answer?
Find the distance covered in 5 seconds.
a)
25 m
b)
10 m
c)
20 m
d)
none of these
|
|
Anita Bhowmik answered |
According to the graph, when the point is at 5 seconds on the x- axis, then it is on 25 metre on the y- axis. Hence, it proves that it travells 25 metres in 5 seconds, hence option a is correct.. It was pretty simple sum actually.
Find the coordinates of the point A from the graph. 
- a)(-4, 5)
- b)(-4, 0)
- c)(0, -4)
- d)none of these
Correct answer is option 'B'. Can you explain this answer?
Find the coordinates of the point A from the graph.
a)
(-4, 5)
b)
(-4, 0)
c)
(0, -4)
d)
none of these
|
|
Glory Lobulu answered |
In reading or writing coordinates of points we start by reading the X-axis then followed by the Y-axis, therefore the X-axis of A is -4 and its Y-axis is 0 hence the answer will be (-4,0)
The point (4,0) lies on which of the following?- a)x-axis
- b)y-axis
- c)origin
- d)None of the above
Correct answer is option 'A'. Can you explain this answer?
The point (4,0) lies on which of the following?
a)
x-axis
b)
y-axis
c)
origin
d)
None of the above
|
|
Rutuja Kumar answered |
Explanation:
To understand why the point (4,0) lies on the x-axis, we need to understand the Cartesian coordinate system.
Cartesian Coordinate System:
The Cartesian coordinate system is a grid system used to represent points in a plane. It consists of two perpendicular lines called the x-axis and y-axis. The point where these two axes intersect is called the origin.
X-Axis:
The x-axis is the horizontal line on the coordinate plane. It is the line where the y-coordinate is always zero. In other words, any point on the x-axis will have a y-coordinate of zero.
Y-Axis:
The y-axis is the vertical line on the coordinate plane. It is the line where the x-coordinate is always zero. In other words, any point on the y-axis will have an x-coordinate of zero.
Origin:
The origin is the point (0,0) where the x-axis and y-axis intersect. It serves as the reference point for all other points on the coordinate plane.
Point (4,0) on the Coordinate Plane:
Now, let's consider the point (4,0). This point has an x-coordinate of 4 and a y-coordinate of 0.
If we plot this point on the coordinate plane, we can see that it lies on the x-axis. The x-coordinate is positive (4), but the y-coordinate is zero. Therefore, the point (4,0) lies on the x-axis.
Conclusion:
In conclusion, the point (4,0) lies on the x-axis.
A ________ is a bar graph that shows data in intervals.- a)Bar-graph
- b)Histograph
- c)Pie-chart
- d)Line Graph
Correct answer is option 'B'. Can you explain this answer?
A ________ is a bar graph that shows data in intervals.
a)
Bar-graph
b)
Histograph
c)
Pie-chart
d)
Line Graph

|
Siddharth Yadav answered |
A Histograph is a bar graph that shows data in intervals.
Understanding Histograph:
A histograph is a type of bar graph that represents data in intervals or ranges. It is commonly used in statistics to display the frequency distribution of a set of data. The x-axis of a histograph represents the intervals or ranges, while the y-axis represents the frequency or count of data falling within each interval.
Components of a Histograph:
A histograph typically consists of the following components:
1. Title: The title of the histograph provides a brief description of the data being represented.
2. Axes: The histograph has two axes - the x-axis and the y-axis. The x-axis represents the intervals or ranges, and the y-axis represents the frequency or count of data.
3. Intervals or Ranges: The intervals or ranges are displayed on the x-axis. They represent different categories or groups into which the data is divided.
4. Bars: The bars in a histograph are used to represent the frequency or count of data falling within each interval. The height or length of each bar corresponds to the frequency or count.
5. Labels: The histograph may also include labels for the intervals or ranges on the x-axis and the frequency or count on the y-axis. These labels provide additional information and make the graph easier to understand.
Advantages of Histograph:
Histographs are widely used in data analysis due to their several advantages:
1. Visual Representation: Histographs provide a visual representation of data, making it easier to interpret and understand patterns and trends.
2. Frequency Distribution: Histographs effectively display the frequency distribution of data, allowing for a clear understanding of how data is distributed across different intervals.
3. Comparison: Histographs allow for easy comparison of data between different intervals or groups, making it useful for analyzing different categories or variables.
4. Clear and Concise: Histographs provide a clear and concise way of representing data, making it suitable for presenting information to a wide audience.
Conclusion:
In summary, a histograph is a bar graph that represents data in intervals. It is a useful tool for displaying the frequency distribution of data and allows for easy comparison and analysis of different categories or variables.


Chapter doubts & questions for Graphs and Relations - Mathematics for Grade 8 2024 is part of Grade 8 exam preparation. The chapters have been prepared according to the Grade 8 exam syllabus. The Chapter doubts & questions, notes, tests & MCQs are made for Grade 8 2024 Exam. Find important definitions, questions, notes, meanings, examples, exercises, MCQs and online tests here.
Chapter doubts & questions of Graphs and Relations - Mathematics for Grade 8 in English & Hindi are available as part of Grade 8 exam.
Download more important topics, notes, lectures and mock test series for Grade 8 Exam by signing up for free.
Mathematics for Grade 8
24 videos|67 docs|9 tests
|
Signup to see your scores go up within 7 days!
Study with 1000+ FREE Docs, Videos & Tests
10M+ students study on EduRev
|
© EduRev
|
Education Revolution
|


Follow Us
|


Signup to see your scores
go up within 7 days!
Access 1000+ FREE Docs, Videos and Tests
Takes less than 10 seconds to signup