


All Exams >
Grade 8 >
Mathematics for Grade 8 >
All Questions
All questions of Data Management for Grade 8 Exam

| 1 Crore+ students have signed up on EduRev. Have you? Download the App |
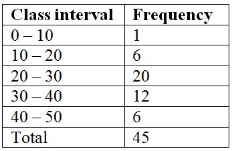
What is the size of class intervals?
- a)10
- b)15
- c)20
- d)5
Correct answer is option 'A'. Can you explain this answer?
What is the size of class intervals?
a)
10
b)
15
c)
20
d)
5

|
Rajat Tyagi answered |
Answer is A because there is a difference of 10 only
In the class- interval 70-80, 80 is the- a)upper limit
- b)frequency
- c)range
- d)lower limit
Correct answer is option 'A'. Can you explain this answer?
In the class- interval 70-80, 80 is the
a)
upper limit
b)
frequency
c)
range
d)
lower limit
|
|
Ritu Joshi answered |
Upper Limit. Let the greatest term of a sequence be a term which is greater than
- a)40 – 50
- b)20 – 30
- c)10 – 20
- d)30 – 40
Correct answer is option 'B'. Can you explain this answer?
a)
40 – 50
b)
20 – 30
c)
10 – 20
d)
30 – 40
|
|
Geetika Shah answered |
20 has the highest frequency as option b because as you have seen and frequency table the highest frequency is friendly only so it shows that it has the highest frequency and don't you feel bad I may tell you one thing this thing should not be asked you know these are very easy and you can see just a frequency table.
The class mark of 95- 100 is- a)95.5
- b)97.5
- c)95
- d)100
Correct answer is option 'B'. Can you explain this answer?
The class mark of 95- 100 is
a)
95.5
b)
97.5
c)
95
d)
100
|
|
Aditi Saxena answered |
Class Mark = (Upper Limit + Lower Limit)/2
So, for the given problem;
Class mark = [(95+100)/2] = 97.5
Thus, class mark is 97.5.
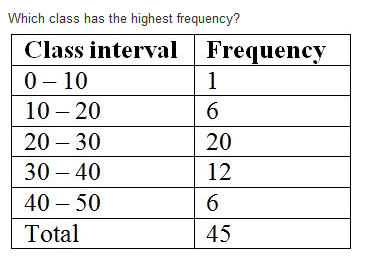
Which class has the highest frequency?

- a)30 – 40
- b)20 – 30
- c)10 – 20
- d)None of thes
Correct answer is option 'B'. Can you explain this answer?
Which class has the highest frequency?
a)
30 – 40
b)
20 – 30
c)
10 – 20
d)
None of thes

|
Sona answered |
Answer is A because it is asking Highest frequency and the highest frequency is 30 - 40
When a die is thrown, total number of possible outcomes is ______.
- a)6
- b)36
- c)2
- d)None of these
Correct answer is option 'A'. Can you explain this answer?
When a die is thrown, total number of possible outcomes is ______.
a)
6
b)
36
c)
2
d)
None of these
|
|
Sanjana Banerjee answered |
Number of Possible Outcomes when Throwing a Die
The correct answer is option 'A' - 6.
Explanation:
A die is a cube-shaped object with six faces, each containing a different number ranging from 1 to 6. When a die is thrown, there are several possible outcomes or results.
Here's a detailed explanation:
1. Understanding the Die:
- A die is a solid object with six faces.
- Each face of the die has a different number from 1 to 6.
- The numbers on opposite faces of the die always add up to 7.
2. Possible Outcomes:
- When throwing a die, the possible outcomes are determined by the number of faces on the die.
- Since a die has six faces, there are six possible outcomes when it is thrown.
- These outcomes are the numbers displayed on the top face after the die comes to rest.
3. Identifying the Total Number of Possible Outcomes:
- To find the total number of possible outcomes, we count all the different numbers that can appear on the top face of the die after it is thrown.
- Since the die has six faces with different numbers (1, 2, 3, 4, 5, and 6), the total number of possible outcomes is 6.
4. Other Options:
- Option 'B' (36) is incorrect because it represents the total number of possible outcomes when two dice are thrown simultaneously. In this case, each die has six possible outcomes, resulting in a total of 6 x 6 = 36 outcomes.
- Option 'C' (2) is incorrect because it does not accurately represent the number of possible outcomes when throwing a single die.
- Option 'D' (None of these) is incorrect as it does not reflect the correct answer.
In conclusion, when a die is thrown, the total number of possible outcomes is 6, as each face of the die represents a different number.
Can you explain the answer of this question below:The number of times an observation occurs in a data is called its
- A:
Range
- B:
Interval
- C:
Frequency
- D:
Raw data
The answer is C.
The number of times an observation occurs in a data is called its
Range
Interval
Frequency
Raw data
|
|
Shubham Sharma answered |
The frequency of a particular data value is the number of times the data value occurs. For example, if four students have a score of 80 in mathematics, and then the score of 80 is said to have a frequency of 4. The frequency of a data value is often represented by ' f '.
What is the frequency of class interval 300-325?

- a)20
- b)25
- c)50
- d)None of these
Correct answer is option 'A'. Can you explain this answer?
What is the frequency of class interval 300-325?
a)
20
b)
25
c)
50
d)
None of these

|
Shreya Baheti answered |
There is asked the frequency and frequency means the number that gave in that interval and the interval was 300-325 and if you look there infornt of that interval there is frequency that is 20 ....ok
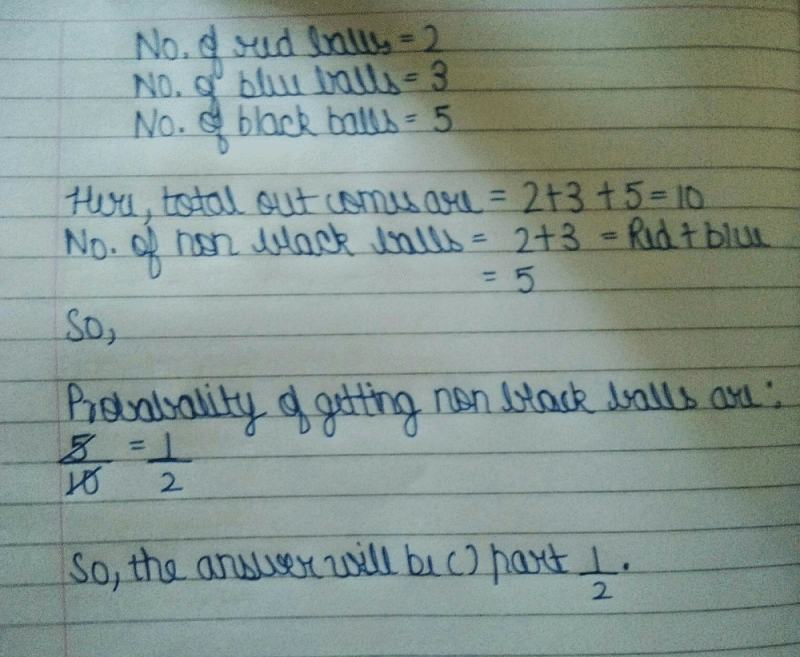
There are 2 Red, 3 Blue and 5 Black balls in a bag. A ball is drawn from the bag without looking in to the bag. What is the probability of getting a non-red ball?- a)3/5
- b)4/5
- c)2/5
- d)None of these
Correct answer is option 'B'. Can you explain this answer?
There are 2 Red, 3 Blue and 5 Black balls in a bag. A ball is drawn from the bag without looking in to the bag. What is the probability of getting a non-red ball?
a)
3/5
b)
4/5
c)
2/5
d)
None of these
|
|
Amit Kumar answered |
Non - red ball = 8
Probability = No of non red balls/Total no. of outcomes
= 8/10 = 4/5
Probability = No of non red balls/Total no. of outcomes
= 8/10 = 4/5
18 out of 36 people love reading, so reading in the pie chart will be represented by- a)36 degree sector
- b)quarter sector
- c)semi circular sector
- d)None of these
Correct answer is option 'C'. Can you explain this answer?
18 out of 36 people love reading, so reading in the pie chart will be represented by
a)
36 degree sector
b)
quarter sector
c)
semi circular sector
d)
None of these
|
|
Rashmi Choudhary answered |
When we find the central angel on pie chart we get 18/36*360•=180•which is half of pie.so we write that semi circular sector love reading.
What is the size of the class interval?
- a)15
- b)5
- c)20
- d)10
Correct answer is option 'D'. Can you explain this answer?
What is the size of the class interval?
a)
15
b)
5
c)
20
d)
10
|
|
Aditya Shah answered |
Class interval refers to the numerical width of any class in a particular distribution. It is defined as the difference between the upper-class limit and the lower class limit. Class Interval = Upper-Class limit – Lower class limit.
The shape of a pie-chart is- a)circular
- b)rectangular
- c)square
- d)oval
Correct answer is option 'A'. Can you explain this answer?
The shape of a pie-chart is
a)
circular
b)
rectangular
c)
square
d)
oval
|
|
Sarita Verma answered |
A pie chart (or a circle chart) is a circular statistical graphic which is divided into
The difference between the upper and lower limit is called
- a)class size
- b)class interval
- c)class mark
- d)group
Correct answer is option 'B'. Can you explain this answer?
The difference between the upper and lower limit is called
a)
class size
b)
class interval
c)
class mark
d)
group

|
Sanjana Bose answered |
The difference between the upper limit and the lower limit of the class interval is called class size.

There are 2 Red, 3 Blue and 5 Black balls in a bag. A ball is drawn from the bag without looking in to the bag. What is the probability of getting a blue ball?
- a)3/5
- b)2/5
- c)3/10
- d)None of these
Correct answer is option 'C'. Can you explain this answer?
There are 2 Red, 3 Blue and 5 Black balls in a bag. A ball is drawn from the bag without looking in to the bag. What is the probability of getting a blue ball?
a)
3/5
b)
2/5
c)
3/10
d)
None of these
|
|
Krishna Singi answered |
Because
no. of ball/TOTAL no of ball
3/10
HENCE OPTION C 3/10 OS THE CORRECT ANSWER
no. of ball/TOTAL no of ball
3/10
HENCE OPTION C 3/10 OS THE CORRECT ANSWER
Two dice are thrown, find and number of outcomes.
- a)36
- b)6
- c)12
- d)None of these
Correct answer is option 'A'. Can you explain this answer?
Two dice are thrown, find and number of outcomes.
a)
36
b)
6
c)
12
d)
None of these
|
|
Kavya Saxena answered |
We know that in a single thrown of two die, the total number of possible outcomes is (6 × 6) = 36. Let S be the sample space. Then, n(S) = 36
When two dice are thrown, each die has 6 faces, numbered from 1 to 6. To find the total number of outcomes when both dice are thrown, you can use the multiplication principle.
- Outcomes for the first die: There are 6 possible outcomes (1, 2, 3, 4, 5, 6).
- Outcomes for the second die: Similarly, there are also 6 possible outcomes.
To find the total number of outcomes when both dice are thrown, multiply the number of outcomes for the first die by the number of outcomes for the second die:
Total Outcomes=Outcomes for the first die×Outcomes for the second die=6×6=36\text{Total Outcomes} = \text{Outcomes for the first die} \times \text{Outcomes for the second die} = 6 \times 6 = 36Total Outcomes=Outcomes for the first die×Outcomes for the second die=6×6=36
Conclusion
So, when two dice are thrown, there are a total of 36 possible outcomes. Each outcome can be represented as an ordered pair (x, y), where x is the result from the first die and y is the result from the second die. For example, (1, 1), (1, 2), ..., (6, 6).
What is the lower limit of the class interval 40 – 50?
- a)40
- b)50
- c)10
- d)none of these
Correct answer is option 'A'. Can you explain this answer?
What is the lower limit of the class interval 40 – 50?
a)
40
b)
50
c)
10
d)
none of these
|
|
Amit Sharma answered |
Lower limit is the least number of the interval. Hence 40 is the lowest limit.
What is the size of class intervals?

- a)25
- b)27
- c)26
- d)None of these
Correct answer is option 'A'. Can you explain this answer?
What is the size of class intervals?
a)
25
b)
27
c)
26
d)
None of these

|
Arpita Patra answered |
Correct answer is (a) as there is written that it is 100 -125 therefore in the option (A) there is written 25 so it is the correct answer
What is the upper limit of the class interval 30 – 40?
- a)40
- b)30
- c)10
- d)none of these
Correct answer is option 'A'. Can you explain this answer?
What is the upper limit of the class interval 30 – 40?
a)
40
b)
30
c)
10
d)
none of these
|
|
Ananya Das answered |
Upper limit is the highest number of the interval. Hence upper limit is 40 in the interval 30-40.
When a coin is thrown, total number of possible outcomes is ______.- a)2
- b)5
- c)6
- d)None of these
Correct answer is option 'A'. Can you explain this answer?
When a coin is thrown, total number of possible outcomes is ______.
a)
2
b)
5
c)
6
d)
None of these
|
|
😉رشی😉 answered |
Because it has only two planes
The pie- chart is divided into- a)circles
- b)squares
- c)sectors
- d)segments
Correct answer is option 'C'. Can you explain this answer?
The pie- chart is divided into
a)
circles
b)
squares
c)
sectors
d)
segments

|
Ashwin Jain answered |
A pie chart (or a circle chart) is a circular statistical graphic which is divided into slices to illustrate numerical proportion. In a pie chart, the arc length of each slice (and consequently its central angle and area), is proportional to the quantity it represents.

There are 2 Red, 3 Blue and 5 Black balls in a bag. A ball is drawn from the bag without looking in to the bag. What is the probability of getting a non-blue ball?- a)7/10
- b)3/5
- c)2/5
- d)None of these
Correct answer is option 'A'. Can you explain this answer?
There are 2 Red, 3 Blue and 5 Black balls in a bag. A ball is drawn from the bag without looking in to the bag. What is the probability of getting a non-blue ball?
a)
7/10
b)
3/5
c)
2/5
d)
None of these
|
|
Sahana Iyer answered |
Total out comes are=2+3+5=10
So, Probability of getting a non blue ball is = 7/10
Which class has the lowest frequency?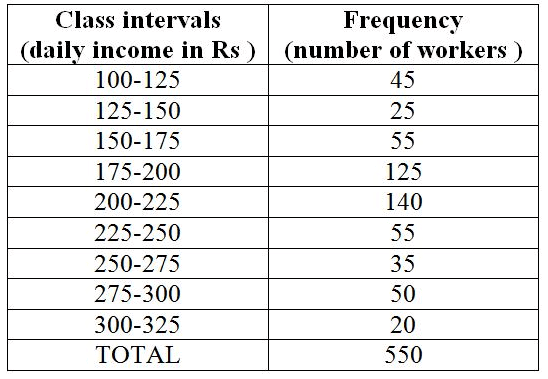
- a)275-300
- b)300-325
- c)250-275
- d)None of these
Correct answer is option 'B'. Can you explain this answer?
Which class has the lowest frequency?
a)
275-300
b)
300-325
c)
250-275
d)
None of these

|
Shalu Garg answered |
300-325 has the lowest frequency because it has the least number of workers.
Which class has the highest frequency?
- a)200-225
- b)225-250
- c)250-275
- d)None of these
Correct answer is option 'A'. Can you explain this answer?
Which class has the highest frequency?
a)
200-225
b)
225-250
c)
250-275
d)
None of these

|
M Gj answered |
In the table 200-225 has the number of workers(frequency) as 140 and all the other frequencies are lesser than that.So the answer is 200-225.
Which class has the lowest frequency?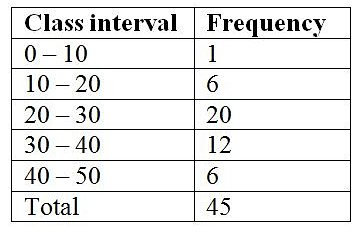
- a)0 – 10
- b)20 – 30
- c)10 – 20
- d)None of these
Correct answer is option 'A'. Can you explain this answer?
Which class has the lowest frequency?
a)
0 – 10
b)
20 – 30
c)
10 – 20
d)
None of these

|
Savana Shelton answered |
The frequency of a class interval is the number of observations that occur in a particular predefined interval
here frequency for the class interval 0-10, is 1 which is lowest among all frquencies...
option A is correct
here frequency for the class interval 0-10, is 1 which is lowest among all frquencies...
option A is correct
Chapter doubts & questions for Data Management - Mathematics for Grade 8 2024 is part of Grade 8 exam preparation. The chapters have been prepared according to the Grade 8 exam syllabus. The Chapter doubts & questions, notes, tests & MCQs are made for Grade 8 2024 Exam. Find important definitions, questions, notes, meanings, examples, exercises, MCQs and online tests here.
Chapter doubts & questions of Data Management - Mathematics for Grade 8 in English & Hindi are available as part of Grade 8 exam.
Download more important topics, notes, lectures and mock test series for Grade 8 Exam by signing up for free.
Mathematics for Grade 8
24 videos|67 docs|9 tests
|
Signup to see your scores go up within 7 days!
Study with 1000+ FREE Docs, Videos & Tests
10M+ students study on EduRev
|
© EduRev
|
Education Revolution
|


Follow Us
|


Signup to see your scores
go up within 7 days!
Access 1000+ FREE Docs, Videos and Tests
Takes less than 10 seconds to signup