


All Exams >
Bank Exams >
Data Interpretation for Competitive Examinations >
All Questions
All questions of Radar Graphs for Bank Exams Exam
Directions: In the question below, the sales of TV and laptop in the subsequent years from 2004 to 2009 is given. The figures given to you is in million. Based on the figure answer the questions below.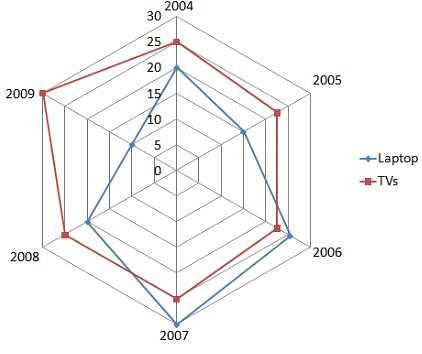 Q. For the data series shown in the above figure, how many years have shown the decrease in sales for both the items in the same year?
- a)One
- b)Two
- c)Three
- d)Four
- e)Six
Correct answer is option 'A'. Can you explain this answer?
Directions: In the question below, the sales of TV and laptop in the subsequent years from 2004 to 2009 is given. The figures given to you is in million. Based on the figure answer the questions below.
Q. For the data series shown in the above figure, how many years have shown the decrease in sales for both the items in the same year?
a)
One
b)
Two
c)
Three
d)
Four
e)
Six
|
|
Ishan Choudhury answered |
We need to find the decrease in sales for both the items given and that too during the same year. This only happens one time in the year 2001 where sales of TV decreases from 20 million to 10 million and sales of laptop decreases from 25 million to 22.5 million. So, the correct answer is A.
| 1 Crore+ students have signed up on EduRev. Have you? Download the App |
Directions: In the question below, the sales of TV and laptop in the subsequent years from 2004 to 2009 is given. The figures given to you is in million. Based on the figure answer the questions below. Q. Which item and for which year shows the highest percentage increase in the sales in the previous year?
- a)Laptop 2007
- b)TV 2007
- c)Laptop 2006
- d)TV 2009
- e)TV 2005
Correct answer is option 'C'. Can you explain this answer?
Directions: In the question below, the sales of TV and laptop in the subsequent years from 2004 to 2009 is given. The figures given to you is in million. Based on the figure answer the questions below.
Q. Which item and for which year shows the highest percentage increase in the sales in the previous year?
a)
Laptop 2007
b)
TV 2007
c)
Laptop 2006
d)
TV 2009
e)
TV 2005
|
|
Aisha Gupta answered |
In this question, we need to find the increase in the percentage of the given items in comparison to previous years. Instead of checking all the years, we will only check percentage increase for the one given in the option. For laptop 2007, in the previous year, the sales were 30 million while in 2006 it was 25.5 so there is an increase of 4.5 million units. Therefore percentage increase will be 4.5/25.5 x 100 = 18%.
Similarly for TV 2007 it will be, 2.5/22.5 x 100 = 11.11 %. For Laptop 2006 it will be, 7.5/15 x 100 = 50 % and for TV 2009, it will be 5/25 x 100 = 20 %. So for laptop 2006, the percentage increase in sales is the highest. Thus, the correct answer is C.
Similarly for TV 2007 it will be, 2.5/22.5 x 100 = 11.11 %. For Laptop 2006 it will be, 7.5/15 x 100 = 50 % and for TV 2009, it will be 5/25 x 100 = 20 %. So for laptop 2006, the percentage increase in sales is the highest. Thus, the correct answer is C.
Directions: Study the following graph carefully to answer the questions that follow.
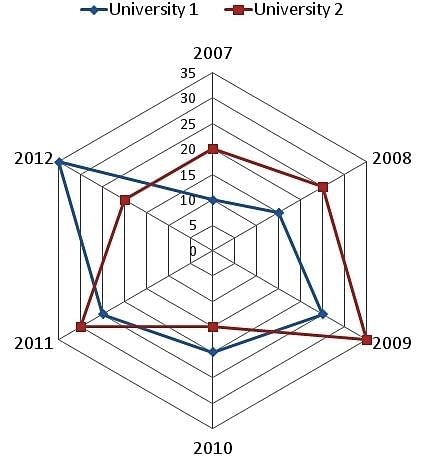
Number of Students (In thousands) in Two Different Universities in Six Different Years
 Q. What was the difference between the number of students in university 1 in the year 2010 and the number of students in university 2 in year 2012?
- a)0
- b)5000
- c)15000
- d)10000
- e)1000
Correct answer is option 'A'. Can you explain this answer?
Directions: Study the following graph carefully to answer the questions that follow.
Number of Students (In thousands) in Two Different Universities in Six Different Years
Number of Students (In thousands) in Two Different Universities in Six Different Years
Q. What was the difference between the number of students in university 1 in the year 2010 and the number of students in university 2 in year 2012?
a)
0
b)
5000
c)
15000
d)
10000
e)
1000
|
|
Nikita Singh answered |
Number of students in university 1 in 2010 = 20000
Number of students in university 2 in 2012 = 20000
Required difference = 20000 – 20000 = 0.
Number of students in university 2 in 2012 = 20000
Required difference = 20000 – 20000 = 0.
Direction: Study the following graph carefully to answer the questions that follow.
Number of Students (In thousands) in Two Different Universities in Six Different Years
 Q. In which year was the difference between the number of students in university 1 and the number of students in university 2 highest?
- a)2008
- b)2009
- c)2010
- d)2011
- e)2012
Correct answer is option 'E'. Can you explain this answer?
Direction: Study the following graph carefully to answer the questions that follow.
Number of Students (In thousands) in Two Different Universities in Six Different Years
Number of Students (In thousands) in Two Different Universities in Six Different Years
Q. In which year was the difference between the number of students in university 1 and the number of students in university 2 highest?
a)
2008
b)
2009
c)
2010
d)
2011
e)
2012
|
|
Nikita Singh answered |
Difference between the students of university 1 and university 2 in 2007 = 2000 – 1000 = 1000
Difference in number of students in 2008 = 25000 – 15000 = 10000
Difference in number of students in 2009 = 35000 – 25000 = 10000
Difference in number of students in 2010 = 20000 – 15000 = 5000
Difference in number of students in 2011 = 30000 – 25000 = 5000
Difference in number of students in 2012 = 35000 – 20000 = 15000
It is clear from above that the difference between the number of students in university 1 and the number of students in university 2 is highest in the year 2012.
Directions: Study the radar chart given below and answer the following questions.
Radar chart shows the markup % and discount % on five different articles sold by a shopkeeper.
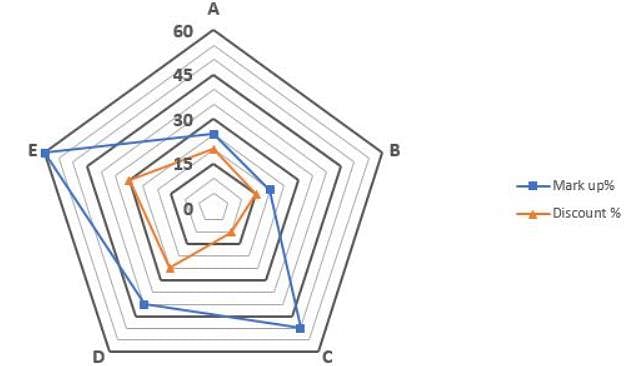
Note:-1. Mark up % on any article=[(Marked Price-Cost Price) of that article)/Cost Price of that article]*100
2.Discount % on any article=[(Marked Price-Selling Price) of that article)/Marked Price of that article]*100Q. If ratio of selling price of A to that of C is 40 : 27, then find marked price of C is what percent of cost price of A?- a)25%
- b)100%
- c)125%
- d)50%
- e)75%
Correct answer is option 'E'. Can you explain this answer?
Directions: Study the radar chart given below and answer the following questions.
Radar chart shows the markup % and discount % on five different articles sold by a shopkeeper.
Radar chart shows the markup % and discount % on five different articles sold by a shopkeeper.
Note:-1. Mark up % on any article=[(Marked Price-Cost Price) of that article)/Cost Price of that article]*100
2.Discount % on any article=[(Marked Price-Selling Price) of that article)/Marked Price of that article]*100
2.Discount % on any article=[(Marked Price-Selling Price) of that article)/Marked Price of that article]*100
Q. If ratio of selling price of A to that of C is 40 : 27, then find marked price of C is what percent of cost price of A?
a)
25%
b)
100%
c)
125%
d)
50%
e)
75%
|
|
Ritika Choudhury answered |
Let selling price of A and that C be Rs 40x & Rs 27x respectively.
So, marked price of C = 27x *100/90 = Rs 30x
And, cost price of A = 40x * 100/80 * 100/125 = Rs 40x
Required% = 30x/40x *100 = 75%
So, marked price of C = 27x *100/90 = Rs 30x
And, cost price of A = 40x * 100/80 * 100/125 = Rs 40x
Required% = 30x/40x *100 = 75%
Directions: Study the following graph carefully to answer the questions that follow.
Number of Students (In thousands) in Two Different Universities in Six Different Years
 Q. What is the sum of the number of students in university 1 in the year 2007 and the number of students in university 2 in the year 2011 together?
- a)50000
- b)55000
- c)45000
- d)57000
- e)40000
Correct answer is option 'E'. Can you explain this answer?
Directions: Study the following graph carefully to answer the questions that follow.
Number of Students (In thousands) in Two Different Universities in Six Different Years
Number of Students (In thousands) in Two Different Universities in Six Different Years
Q. What is the sum of the number of students in university 1 in the year 2007 and the number of students in university 2 in the year 2011 together?
a)
50000
b)
55000
c)
45000
d)
57000
e)
40000
|
|
Aisha Gupta answered |
Number of students in university 1 in 2007 = 10000
Number of students in university 2 in 2011 = 30000
∴ Required sum = 10000 + 30000 = 40000.
Number of students in university 2 in 2011 = 30000
∴ Required sum = 10000 + 30000 = 40000.
Directions: In the question below, the sales of TV and laptop in the subsequent years from 2004 to 2009 is given. The figures given to you is in million. Based on the figure answer the questions below. Q. Which year shows the highest percentage decrease in the total sales of the two items?
- a)2005
- b)2006
- c)2008
- d)2009
- e)2007
Correct answer is option 'C'. Can you explain this answer?
Directions: In the question below, the sales of TV and laptop in the subsequent years from 2004 to 2009 is given. The figures given to you is in million. Based on the figure answer the questions below.
Q. Which year shows the highest percentage decrease in the total sales of the two items?
a)
2005
b)
2006
c)
2008
d)
2009
e)
2007
|
|
Ishan Choudhury answered |
We need to first calculate the total sales of both the items in each of the years given above. The total sales will be:
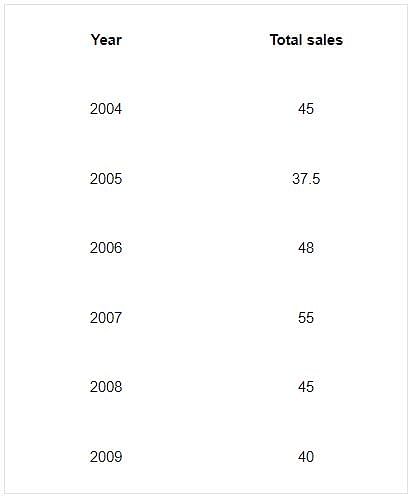
Now, from the table, you can see the decrease in sales occurs only thrice during 2005, 2008, and 2009. So we will calculate percentage decrease for only these three years. For 2005 decrease in sales are 7.5 million. So, the percentage decrease from the previous year will be 7.5/45 x 100 = 16.6 %. Sales decreased by 10 million from 2007 to 2008. Thus, the percentage decrease will be 10/55 x 100 = 18.18 %. For 2009 the decrease is 5 million and so the percentage decrease will be, 5/45 x 100 = 11.11 %. So, the highest percentage decrease was noted in 2008 from 2007. So, the correct answer is C.
Now, from the table, you can see the decrease in sales occurs only thrice during 2005, 2008, and 2009. So we will calculate percentage decrease for only these three years. For 2005 decrease in sales are 7.5 million. So, the percentage decrease from the previous year will be 7.5/45 x 100 = 16.6 %. Sales decreased by 10 million from 2007 to 2008. Thus, the percentage decrease will be 10/55 x 100 = 18.18 %. For 2009 the decrease is 5 million and so the percentage decrease will be, 5/45 x 100 = 11.11 %. So, the highest percentage decrease was noted in 2008 from 2007. So, the correct answer is C.
Directions: In the question below, the sales of TV and laptop in the subsequent years from 2004 to 2009 is given. The figures given to you is in million. Based on the figure answer the questions below. Q. Find the ratio of the total number of televisions sold to the total number of laptops sold in all these years.
- a)4: 5
- b)5: 6
- c)5: 4
- d)6: 5
- e)4: 7
Correct answer is option 'C'. Can you explain this answer?
Directions: In the question below, the sales of TV and laptop in the subsequent years from 2004 to 2009 is given. The figures given to you is in million. Based on the figure answer the questions below.
Q. Find the ratio of the total number of televisions sold to the total number of laptops sold in all these years.
a)
4: 5
b)
5: 6
c)
5: 4
d)
6: 5
e)
4: 7
|
|
Aisha Gupta answered |
Here, you only have to add the total number of televisions laptop sold in all these years and compare them to find the ratio. The total number of televisions sold from 2004 to 2009 are 25 + 22.5 + 22.5 + 25 + 25 + 30 = 150. And the total number of laptops sold are: 20 + 15 + 25 .5 + 30 + 20 + 10 = 120.5. Thus the ratio of the is 150: 120.5 = 5: 4. So, the correct answer is C.
Directions: Study the following graph carefully to answer the questions that follow.
Number of Students (In thousands) in Two Different Universities in Six Different Years
 Q. If 25% of the students in university 2 in the year 2010 were females, what was the number of male students in the university 2 in the same year?
- a)11250
- b)12350
- c)12500
- d)11500
- e)11750
Correct answer is option 'A'. Can you explain this answer?
Directions: Study the following graph carefully to answer the questions that follow.
Number of Students (In thousands) in Two Different Universities in Six Different Years
Number of Students (In thousands) in Two Different Universities in Six Different Years
Q. If 25% of the students in university 2 in the year 2010 were females, what was the number of male students in the university 2 in the same year?
a)
11250
b)
12350
c)
12500
d)
11500
e)
11750
|
|
Nikita Singh answered |
Total students in university 2 in 2010 = 15000
∴ Number of girls = 15000 × 25/100 = 3750
and number of boys = 15000 – 3750 = 11250.
∴ Number of girls = 15000 × 25/100 = 3750
and number of boys = 15000 – 3750 = 11250.
Directions: In the question below, the sales of TV and laptop in the subsequent years from 2004 to 2009 is given. The figures given to you is in million. Based on the figure answer the questions below. Q. How many times do the sales of a laptop less than the TV in the given years?
- a)One
- b)Two
- c)Three
- d)Four
- e)None of the above
Correct answer is option 'D'. Can you explain this answer?
Directions: In the question below, the sales of TV and laptop in the subsequent years from 2004 to 2009 is given. The figures given to you is in million. Based on the figure answer the questions below.
Q. How many times do the sales of a laptop less than the TV in the given years?
a)
One
b)
Two
c)
Three
d)
Four
e)
None of the above
|
|
Aisha Gupta answered |
Here the sales of televisions and laptops of six different years are given. You need to see that in which year the sale of TV was greater than the sale of the laptop. The values of different sales of units are given to you in the radar diagram above.
From the figure you can see that sales of the laptops in 2004 were lower than the sales TVs in 2004, similarly, sales of a laptop in 2005, 2008, and 2009 was lower than the sale of TVs in that year. So, there are four years where the sale of the laptop was lower than the sale of TV. Thus, the correct answer is D.
From the figure you can see that sales of the laptops in 2004 were lower than the sales TVs in 2004, similarly, sales of a laptop in 2005, 2008, and 2009 was lower than the sale of TVs in that year. So, there are four years where the sale of the laptop was lower than the sale of TV. Thus, the correct answer is D.
Chapter doubts & questions for Radar Graphs - Data Interpretation for Competitive Examinations 2024 is part of Bank Exams exam preparation. The chapters have been prepared according to the Bank Exams exam syllabus. The Chapter doubts & questions, notes, tests & MCQs are made for Bank Exams 2024 Exam. Find important definitions, questions, notes, meanings, examples, exercises, MCQs and online tests here.
Chapter doubts & questions of Radar Graphs - Data Interpretation for Competitive Examinations in English & Hindi are available as part of Bank Exams exam.
Download more important topics, notes, lectures and mock test series for Bank Exams Exam by signing up for free.
Data Interpretation for Competitive Examinations
17 videos|9 docs|42 tests
|
Signup to see your scores go up within 7 days!
Study with 1000+ FREE Docs, Videos & Tests
10M+ students study on EduRev
|
© EduRev
|
Education Revolution
|


Follow Us
|


Signup to see your scores
go up within 7 days!
Access 1000+ FREE Docs, Videos and Tests
Takes less than 10 seconds to signup