


All Exams > Class 10 > Mathematics (Maths) Class 10 > All Questions
All questions of Statistics for Class 10 Exam
If mean = (3 median - mode). k, then the value of k is- a)1
- b)2
- c)1/2
- d)3/2
Correct answer is option 'C'. Can you explain this answer?
If mean = (3 median - mode). k, then the value of k is
a)
1
b)
2
c)
1/2
d)
3/2
| | Kiran Mehta answered |
∵ Mode = 3 median - 2 mean
⇒ 2 mean = 3 m edian - mode

⇒ 2 mean = 3 m edian - mode

The class mark of the class 15.5 - 20.5 - a)15.5
- b)20.5
- c)18
- d)5
Correct answer is option 'C'. Can you explain this answer?
The class mark of the class 15.5 - 20.5
a)
15.5
b)
20.5
c)
18
d)
5
 | Crafty Classes answered |
class mark= (upper limit+lower limit)/2
= (15.5+20.5)/2
=36/2
=18
= (15.5+20.5)/2
=36/2
=18
Mode and mean of a data are 12k and 15k. Median of the data is- a)12k
- b)14k
- c)15k
- d)16k
Correct answer is option 'B'. Can you explain this answer?
Mode and mean of a data are 12k and 15k. Median of the data is
a)
12k
b)
14k
c)
15k
d)
16k
| | Amit Kumar answered |
Here's the solution to your question:
If two values are given in the below formula than we can use the formula if one is given than we cannot use the formula
3median = 2mean+mode
3median = 2(15k)+12k
3median = 30k+12k
3median = 42k
median = 42k/3
median = 14k
You can understand all the concepts of Class 10 mathematics through the link:

The class marks of the class 18-22 is- a)4
- b)18
- c)22
- d)20
Correct answer is option 'D'. Can you explain this answer?
The class marks of the class 18-22 is
a)
4
b)
18
c)
22
d)
20
| | Harshit Agrawal answered |
We know that ,
Class Mark = upper limit + lower limit /2
--->. Class Mark = 22 + 18/2
--->. Class Mark = 40/2
--->. Class Mark = 20
Hence , option D is correct.
Class Mark = upper limit + lower limit /2
--->. Class Mark = 22 + 18/2
--->. Class Mark = 40/2
--->. Class Mark = 20
Hence , option D is correct.
The graphical representation of a cumulative frequency distribution is called- a)Bar graph
- b)Histogram
- c)Frequency polygon
- d)Ogive
Correct answer is option 'D'. Can you explain this answer?
The graphical representation of a cumulative frequency distribution is called
a)
Bar graph
b)
Histogram
c)
Frequency polygon
d)
Ogive
| | Anjana Khatri answered |
The graphical representation of a cumulative frequency distribution is called an ogive.
An ogive is a graph that plots the cumulative frequency of a set of data on the y-axis and the data values on the x-axis. It is used to represent the distribution of continuous data and is shaped like a curve.
A frequency polygon is also a graph that represents the frequency distribution of a set of data, but it is shaped like a polygon with straight lines connecting the data points. A bar graph is a graph that uses bars to represent the frequencies or counts of a set of data, and a histogram is a graph that represents the frequency distribution of continuous data using bars.
The abscissa of the point of intersection of both types (less than & more than) of cumulative frequency curves help in finding- a)mean
- b)median
- c)mode
- d)None of these
Correct answer is option 'B'. Can you explain this answer?
The abscissa of the point of intersection of both types (less than & more than) of cumulative frequency curves help in finding
a)
mean
b)
median
c)
mode
d)
None of these
| | Aman kamat answered |
The abscissa of the point of intersection of both types of cumulative frequency curves helps in finding the median.
The median is the middle value in a dataset, and it divides the dataset into two equal parts. When we plot the cumulative frequency curve, we can find the median by finding the point of intersection of the two types of curves.
The point of intersection of the less than and more than cumulative frequency curves represents the median value. This is because at this point, half of the observations are below this value, and half of the observations are above this value.
The abscissa of the point of intersection does not help in finding the mean or mode. The mean is calculated by summing up all the observations and dividing by the number of observations. The mode is the value that appears most frequently in a dataset.
Therefore, the correct answer is (b) median.


In the formula for finding the mean of a grouped frequency distribution, ui =- a)

- b)h(xi - a)
- c)

- d)

Correct answer is option 'C'. Can you explain this answer?
In the formula for finding the mean of a grouped frequency distribution, ui =
a)
b)
h(xi - a)
c)
d)
 | Kamna Science Academy answered |
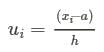

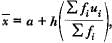 this is step deviation formula used for finding mean
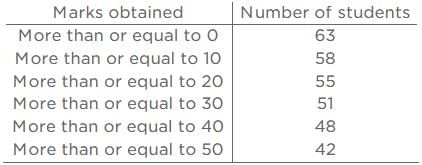

The runs scored by a batsman in 35 different matches are given below:

The number of matches in which the batsman scored less than 60 runs are- a)16
- b)24
- c)8
- d)19
Correct answer is option 'B'. Can you explain this answer?
The runs scored by a batsman in 35 different matches are given below:
The number of matches in which the batsman scored less than 60 runs are
The number of matches in which the batsman scored less than 60 runs are
a)
16
b)
24
c)
8
d)
19
 | Kds Coaching answered |
We need to find the number of matches in which the batsman scored less than 60 runs.
Step 1: Identify the relevant class intervals
The batsman scored less than 60 runs in the following class intervals:
- 0–15 (Frequency = 5)
- 15–30 (Frequency = 7)
- 30–45 (Frequency = 4)
- 45–60 (Frequency = 8)
Step 2: Sum the frequencies
Total number of matches where runs scored < 60:
= 5 + 7 + 4 + 8
= 24 matches
= 5 + 7 + 4 + 8
= 24 matches
Final Answer:
The number of matches in which the batsman scored less than 60 runs is 24.
Chapter doubts & questions for Statistics - Mathematics (Maths) Class 10 2026 is part of Class 10 exam preparation. The chapters have been prepared according to the Class 10 exam syllabus. The Chapter doubts & questions, notes, tests & MCQs are made for Class 10 2026 Exam. Find important definitions, questions, notes, meanings, examples, exercises, MCQs and online tests here.
Chapter doubts & questions of Statistics - Mathematics (Maths) Class 10 in English & Hindi are available as part of Class 10 exam. Download more important topics, notes, lectures and mock test series for Class 10 Exam by signing up for free.
Mathematics (Maths) Class 10118 videos|526 docs|45 tests |