


All Exams >
Commerce >
Mathematics (Maths) Class 11 >
All Questions
All questions of Statistics for Commerce Exam
What is the range of the following data?23, 45, 34, 21, 89, 45, 47, 91- a)70
- b)56
- c)71
- d)69
Correct answer is option 'A'. Can you explain this answer?
What is the range of the following data?
23, 45, 34, 21, 89, 45, 47, 91
a)
70
b)
56
c)
71
d)
69
|
|
Vikas Kapoor answered |
Maximum and minimum value of the data 23, 45, 34, 21, 89, 45, 47, 91 are 21 and 91.
Range = 91 – 21 = 70
Range = 91 – 21 = 70
| 1 Crore+ students have signed up on EduRev. Have you? Download the App |
The mean deviation of the following data 14, 15, 16, 17, 13 is:- a)4
- b)2.3
- c)3
- d)1.2
Correct answer is option 'D'. Can you explain this answer?
The mean deviation of the following data 14, 15, 16, 17, 13 is:
a)
4
b)
2.3
c)
3
d)
1.2
|
|
Vikas Kapoor answered |
Here N= 5 , sigma x = 75
so mean = 15
now taking deviation from mean,( By ignoring signs)
we get sigma deviation from mean = 6
Now applying the formula of mean deviation
M.D.= SIGMA deviation from mean/ n
so M.D.= 6/5
= 1.2
so mean = 15
now taking deviation from mean,( By ignoring signs)
we get sigma deviation from mean = 6
Now applying the formula of mean deviation
M.D.= SIGMA deviation from mean/ n
so M.D.= 6/5
= 1.2
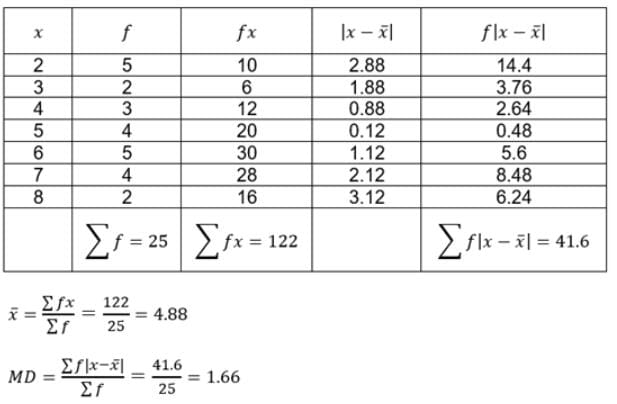
The mean of 5 observations is 4.4 and their variance is 8.24. If three observations are 1,2 and 6 , the other two observations are- a)4 and 8
- b)5 and 7
- c)5 and 9
- d)4 and 9
Correct answer is option 'D'. Can you explain this answer?
The mean of 5 observations is 4.4 and their variance is 8.24. If three observations are 1,2 and 6 , the other two observations are
a)
4 and 8
b)
5 and 7
c)
5 and 9
d)
4 and 9
|
|
Gaurav Kumar answered |
Let the other nos. be a and b
then (x+y+1+2+6)/5 = 4.4
x + y = 13 ---------------------(1)
Variance = 8.24
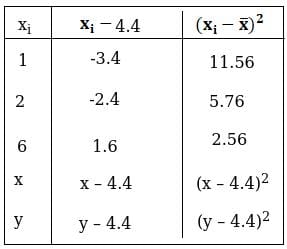
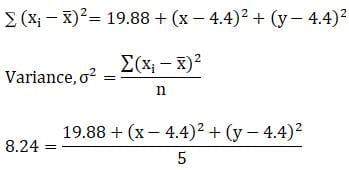
41.2 = 19.88 + (x2 + 19.36 – 8.8x) + (y2 + 19.36 – 8.8y)
21.32 = x2 + y2 + 38.72 – 8.8(x + y)
x2 + y2 + 38.72 – 8.8(13) – 21.32 = 0
(using equation (1))
x2 + y2 – 97 = 0 …(2)
Squaring equation (1) both the sides,
we get (x + y)2 = (13)^2
x2 + y2 + 2xy = 169
97 + 2xy = 169
(using equation (2))
xy = 36 or x = 36/y (1)
⇒ 36/y + y = 13
y2 + 36 = 13y
y2 – 13y + 36 = 0
(y – 4)(y – 9) = 0
Either (y – 4) = 0 or (y – 9) = 0
⇒ y = 4 or y = 9
For y = 4 x = 36/y
= 36/4 = 12
For y = 9
x = 36/9
x = 4
Thus, remaining two observations are 4 and 9.
then (x+y+1+2+6)/5 = 4.4
x + y = 13 ---------------------(1)
Variance = 8.24
41.2 = 19.88 + (x2 + 19.36 – 8.8x) + (y2 + 19.36 – 8.8y)
21.32 = x2 + y2 + 38.72 – 8.8(x + y)
x2 + y2 + 38.72 – 8.8(13) – 21.32 = 0
(using equation (1))
x2 + y2 – 97 = 0 …(2)
Squaring equation (1) both the sides,
we get (x + y)2 = (13)^2
x2 + y2 + 2xy = 169
97 + 2xy = 169
(using equation (2))
xy = 36 or x = 36/y (1)
⇒ 36/y + y = 13
y2 + 36 = 13y
y2 – 13y + 36 = 0
(y – 4)(y – 9) = 0
Either (y – 4) = 0 or (y – 9) = 0
⇒ y = 4 or y = 9
For y = 4 x = 36/y
= 36/4 = 12
For y = 9
x = 36/9
x = 4
Thus, remaining two observations are 4 and 9.
A batsman scores runs in 10 innings as 38,70,48,34,42,55,63,46,54 and 44 , then the mean score is- a)4.94
- b)49.4
- c)494
- d)0.494
Correct answer is option 'B'. Can you explain this answer?
A batsman scores runs in 10 innings as 38,70,48,34,42,55,63,46,54 and 44 , then the mean score is
a)
4.94
b)
49.4
c)
494
d)
0.494
|
|
Mayuri Agrawal answered |
38+70+48+34+42+55+63+46+54 +44=494
494/10
=49.4
494/10
=49.4
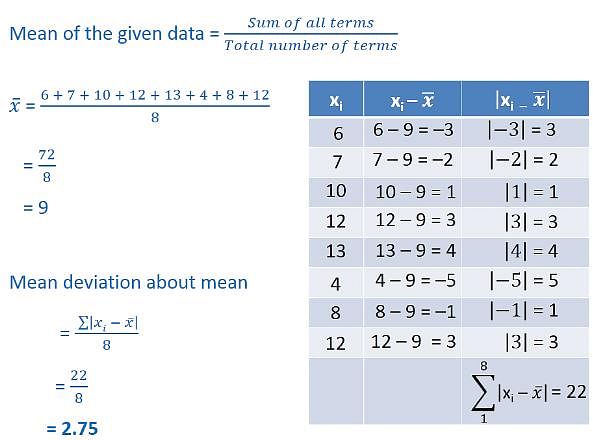
The mean deviation about the mean for the following data:5, 6, 7, 8, 6, 9, 13, 12, 15 is:- a)1.5
- b)3.2
- c)2.89
- d)5
Correct answer is option 'C'. Can you explain this answer?
The mean deviation about the mean for the following data:
5, 6, 7, 8, 6, 9, 13, 12, 15 is:
a)
1.5
b)
3.2
c)
2.89
d)
5
|
|
Vikas Kapoor answered |
let, X =5,6,7,8,9,13,12,15.
(5+6+7+8+9+13+12+15)÷9 = 9.
and hence a = 9.
the mean deviation about the mean is summation of |X-a|÷ the total number
i.e , |X-a| = 4,3,2,1,3,0,4,3,6 and the total no. is 9.
hence summation of |X-a| = 26,
the mean deviation is 26 ÷ 9 = 2.89 ans
(5+6+7+8+9+13+12+15)÷9 = 9.
and hence a = 9.
the mean deviation about the mean is summation of |X-a|÷ the total number
i.e , |X-a| = 4,3,2,1,3,0,4,3,6 and the total no. is 9.
hence summation of |X-a| = 26,
the mean deviation is 26 ÷ 9 = 2.89 ans

For a given data, the standard deviation is 20.If 3 is added to each observation , what is the new variance of the resulting observations?- a)20
- b)23
- c)17
- d)60
Correct answer is option 'A'. Can you explain this answer?
For a given data, the standard deviation is 20.If 3 is added to each observation , what is the new variance of the resulting observations?
a)
20
b)
23
c)
17
d)
60
|
|
Sarita Yadav answered |
If a three, is added to each number in a set of data, the mean will be increased by 3 and the standard deviation will be unaltered (since the spread of the data will be unchanged).
Hence, variance of the new data = 20
Hence, variance of the new data = 20
The mean deviation about the mean for the following data 3, 7, 8, 9, 4, 6, 8, 13, 12, 10 is:- a)5
- b)3
- c)2
- d)2.4
Correct answer is option 'D'. Can you explain this answer?
The mean deviation about the mean for the following data 3, 7, 8, 9, 4, 6, 8, 13, 12, 10 is:
a)
5
b)
3
c)
2
d)
2.4
|
|
Gaurav Kumar answered |
Arrange data in ascending order,
3,4,6,7,8,8,9,10,12,13
No. of observations = 10
Median = n/2 => 10/2 = 5h observation.
5th observation is 8
Now we calculate mean deviation about median, i.e;
=> ∑∣xi−M∣/10
= {|3-8| +|4-8| +|6-8| +|7-8| +|8-8| +|8-8| +|9-8| +|10-8| +|12-8| +|13-8| }/10
= { 5 + 4 + 2 + 1 + 0 + 0 + 1 + 2 + 4 + 5}/10
= 24/10 => 2.4
The two lines of regression are 2x - 7y + 6 = 0 and 7x – 2y +1 = 0. What is correlation coefficient between x and y ?- a)4/49
- b)- 2/7
- c)2/7
- d)none of these
Correct answer is option 'C'. Can you explain this answer?
The two lines of regression are 2x - 7y + 6 = 0 and 7x – 2y +1 = 0. What is correlation coefficient between x and y ?
a)
4/49
b)
- 2/7
c)
2/7
d)
none of these
|
|
Hansa Sharma answered |
ρ = (b(xy) * b(yx))
But sign of ρρ is same as sign of b(xy), b(yx)
Therefore, ρ = 2/7
But sign of ρρ is same as sign of b(xy), b(yx)
Therefore, ρ = 2/7
The standard deviation of first 10 multiples of 4 is:- a)7
- b)8
- c)11.5
- d)14
Correct answer is option 'C'. Can you explain this answer?
The standard deviation of first 10 multiples of 4 is:
a)
7
b)
8
c)
11.5
d)
14
|
|
Krishna Iyer answered |
First 10 multiples of 4 are 4,8,12...40.
This is an A.P.
sum=n/2(a+l)
= 10/2(4+40)
∴ sum=220.
Mean, u=sum/n
= 220/10 = 22
D1 = 4-22 = -18
D2 = 8-22 = -16
D3 = 12-22 = -10
D4 = 16- 22 = -8
Similarly we subtract multiple of 4 by 22 upto 10 terms we get
-18, -14, -10, -8………...18
S.D. = σ2 = ∑(D2)/n
=[ (-18)2 ,(-14)2, (-10)2, (-6)2 + (-2)2 +(6)2 + (10)2 + (14)2 + (18)2]/10
Solving this, we get
σ = 11.5
The H.M. of 4,8,16 is- a)6.7
- b)7.8
- c)6.85
- d)6.4
Correct answer is option 'C'. Can you explain this answer?
The H.M. of 4,8,16 is
a)
6.7
b)
7.8
c)
6.85
d)
6.4
|
|
Vivek answered |
HM = 3*(1/4 + 1/8 + 1/16)-¹
= 6.85
KEY POINT →→ HM of n terms = n*[1/a + 1/b + (upto
n terms) ]-¹
For a given data, the variance is 15. If each observation is multiplied by 2, what is the new variance of the resulting observations?- a)15
- b)60
- c)30
- d)7.5
Correct answer is option 'B'. Can you explain this answer?
For a given data, the variance is 15. If each observation is multiplied by 2, what is the new variance of the resulting observations?
a)
15
b)
60
c)
30
d)
7.5
|
|
Poonam Reddy answered |
Variance = 15
New variance = 22*15
= 4*15
= 60
New variance = 22*15
= 4*15
= 60
The S.D. of the observations 22,26,28,20,24,30 is- a)3
- b)2.4
- c)3.42
- d)2
Correct answer is option 'C'. Can you explain this answer?
The S.D. of the observations 22,26,28,20,24,30 is
a)
3
b)
2.4
c)
3.42
d)
2
|
|
Lavanya Menon answered |
μ = (22 + 26 + 28 + 20 + 24 + 30)/6
= 150/6
= 25
x(i) = (xi - μ)2
x(22) = (22-25)2 = 9
x(26) = (26-25)2 = 1
x(28) = (28-25)2 = 9
x(20) = (20-25)2 = 25
x(24) = (24-25)2 = 1
x(30) = (30-25)2 = 25
(xi - μ)2 = 70
Standard deviation : [(xi - μ)2]/N
= (70/6)½
= 3.42
= 150/6
= 25
x(i) = (xi - μ)2
x(22) = (22-25)2 = 9
x(26) = (26-25)2 = 1
x(28) = (28-25)2 = 9
x(20) = (20-25)2 = 25
x(24) = (24-25)2 = 1
x(30) = (30-25)2 = 25
(xi - μ)2 = 70
Standard deviation : [(xi - μ)2]/N
= (70/6)½
= 3.42
If the coefficient of variation between x and y is 0.28, covariance between x and y is 7.6, and the variance of x is 9, then the S.D. of the y series is- a)10.05
- b)10.1
- c)9.05
- d)9.8
Correct answer is option 'C'. Can you explain this answer?
If the coefficient of variation between x and y is 0.28, covariance between x and y is 7.6, and the variance of x is 9, then the S.D. of the y series is
a)
10.05
b)
10.1
c)
9.05
d)
9.8
|
|
Hansa Sharma answered |
Correlation coefficient = cov (x,y)/ (std deviation (x) ×std deviation (y))
Correlation coefficient = 0.28
cov (x,y) = 7.6
variance of x is 9.
=> std deviation (x) = √variance of X = √9 = 3
=> 0.28 = 7.6 / ( 3 * std deviation (y))
=> std deviation (y) = 7.6 / ( 3 * 0.28)
=> std deviation (y) = 9.05
standard deviation of Y series = 9.05
Correlation coefficient = 0.28
cov (x,y) = 7.6
variance of x is 9.
=> std deviation (x) = √variance of X = √9 = 3
=> 0.28 = 7.6 / ( 3 * std deviation (y))
=> std deviation (y) = 7.6 / ( 3 * 0.28)
=> std deviation (y) = 9.05
standard deviation of Y series = 9.05
Mean of the squares of the deviations from mean is called the:- a)Mode
- b)Standard deviation
- c)Variance
- d)Quartile deviation
Correct answer is option 'C'. Can you explain this answer?
Mean of the squares of the deviations from mean is called the:
a)
Mode
b)
Standard deviation
c)
Variance
d)
Quartile deviation
|
|
Jyoti Kapoor answered |
Squared deviations from the mean Squared deviations from the mean (SDM) are involved in various calculations. In probability theory and statistics, the definition of variance is either the expected value of the SDM (when considering a theoretical distribution) or its average value (for actual experimental data).
If in moderately asymmetrical distribution mode and mean of the data are 6 μ and 9 μ respectively, then median is- a)8 μ
- b)6 μ
- c)5 μ
- d)7 μ
Correct answer is option 'A'. Can you explain this answer?
If in moderately asymmetrical distribution mode and mean of the data are 6 μ and 9 μ respectively, then median is
a)
8 μ
b)
6 μ
c)
5 μ
d)
7 μ
|
|
Ananya Das answered |
Median = [mode + 2(mean)]/3
= [6μ+2(9μ)]/3
= 24μ/3
= 8μ
= [6μ+2(9μ)]/3
= 24μ/3
= 8μ
A batsman scores runs in 10 innings 38,70,48,34,42,55,63,46,54 and 44 , then the mean deviation is- a)6.4
- b)9.6
- c)10.6
- d)8.6
Correct answer is option 'D'. Can you explain this answer?
A batsman scores runs in 10 innings 38,70,48,34,42,55,63,46,54 and 44 , then the mean deviation is
a)
6.4
b)
9.6
c)
10.6
d)
8.6
|
|
Jyoti Sengupta answered |
Arranging the given data in ascending order,
we have 34, 38, 42, 44, 46, 48, 54, 55, 63, 70
Here, Median M = (46+48)/2
=47
(∵ n = 10, median is the mean of 5th and 6th items)
∴ Mean deviation = ∑|xi−M|/n
=∑|xi−47|/10
= (13+9+5+3+1+1+7+8+16+23)/10
=8.6
we have 34, 38, 42, 44, 46, 48, 54, 55, 63, 70
Here, Median M = (46+48)/2
=47
(∵ n = 10, median is the mean of 5th and 6th items)
∴ Mean deviation = ∑|xi−M|/n
=∑|xi−47|/10
= (13+9+5+3+1+1+7+8+16+23)/10
=8.6
A teacher conducted a surprise test of Mathematics, Physics and Chemistry for class XI on Monday.The mean and standard deviation of marks obtained by 50 students of the class in three subjects are given below:
 Q. What is the coefficient of variation of marks obtained by the students in Mathematics?
- a)28.57
- b)46.87
- c)48.89
- d)none of these
Correct answer is option 'A'. Can you explain this answer?
A teacher conducted a surprise test of Mathematics, Physics and Chemistry for class XI on Monday.
The mean and standard deviation of marks obtained by 50 students of the class in three subjects are given below:
Q. What is the coefficient of variation of marks obtained by the students in Mathematics?
a)
28.57
b)
46.87
c)
48.89
d)
none of these
|
|
Ananya Das answered |
Standard deviation of Mathematics = 12
The coefficient of variation,
C.V. (in Mathematics) = 12/42 x 100 = 28.57
The mean weight of a group of 10 items is 28 and that of another group of n items is 35.The mean of combined group of 10 + n items is found to be 30. The value of n is- a)12
- b)10
- c)4
- d)2
Correct answer is option 'C'. Can you explain this answer?
The mean weight of a group of 10 items is 28 and that of another group of n items is 35.The mean of combined group of 10 + n items is found to be 30. The value of n is
a)
12
b)
10
c)
4
d)
2

|
Sahana Joshi answered |
sum of weights of 10 items = 280
sum of weights of n items = 35n
so, sum of weights of (10 + n) items = 280 + 35n
so ,mean = (280 + 35 n) / (10 + n)
30(10 + n) = 280 + 35n
solving we get, n = 4
sum of weights of n items = 35n
so, sum of weights of (10 + n) items = 280 + 35n
so ,mean = (280 + 35 n) / (10 + n)
30(10 + n) = 280 + 35n
solving we get, n = 4
Coefficient of correlation between the observations (1, 6) , (2 , 5) , (3 , 4) , (4 , 3) , (5 , 2) , (6 , 1) is- a)0
- b)1
- c)-1
- d)none of these
Correct answer is option 'C'. Can you explain this answer?
Coefficient of correlation between the observations (1, 6) , (2 , 5) , (3 , 4) , (4 , 3) , (5 , 2) , (6 , 1) is
a)
0
b)
1
c)
-1
d)
none of these
|
|
Shanaya Shah answered |
Given observations: (1, 6), (2, 5), (3, 4), (4, 3), (5, 2), (6, 1)
To find the coefficient of correlation, we need to first calculate the mean and standard deviation of both the variables.
Let X be the first variable and Y be the second variable.
Calculating mean:
- Mean of X = (1+2+3+4+5+6)/6 = 3.5
- Mean of Y = (6+5+4+3+2+1)/6 = 3.5
Calculating standard deviation:
- Standard deviation of X = sqrt((1-3.5)^2 + (2-3.5)^2 + (3-3.5)^2 + (4-3.5)^2 + (5-3.5)^2 + (6-3.5)^2) = 1.87
- Standard deviation of Y = sqrt((6-3.5)^2 + (5-3.5)^2 + (4-3.5)^2 + (3-3.5)^2 + (2-3.5)^2 + (1-3.5)^2) = 1.87
Calculating the coefficient of correlation using the formula:
r = Σ((Xi - X̄)(Yi - Ȳ))/sqrt(Σ(Xi - X̄)^2 * Σ(Yi - Ȳ)^2)
Substituting the values,
r = ((-2.5)*4.5 + (-1.5)*2.5 + (-0.5)*0.5 + 0.5*2.5 + 1.5*4.5 + 2.5*6.5)/(1.87^2 * 1.87^2 * 6)
r = -1
Therefore, the coefficient of correlation between the given observations is -1, which indicates a perfect negative correlation.
For a moderately skewed distribution, quartile deviation and the standard deviation are related by- a)S.D. = 3/2 Q.D.
- b)S.D = 3/4 Q.D.
- c)S.D. = 4/3 Q.D.
- d)S.D. = 2/3 Q.D.
Correct answer is option 'A'. Can you explain this answer?
For a moderately skewed distribution, quartile deviation and the standard deviation are related by
a)
S.D. = 3/2 Q.D.
b)
S.D = 3/4 Q.D.
c)
S.D. = 4/3 Q.D.
d)
S.D. = 2/3 Q.D.
|
|
Sushant Chaudhary answered |
The relationship between the mean, quartile and the standard deviation are as follows:
Mean Deviation is the mean of all the absolute deviations of a set of data.
Quartile deviation is the difference between “first and third quartiles” in any distribution.
Standard deviation measures the “dispersion of the data set” that is relative to its mean.
Mean Deviation = 4/5 × Quartile deviation
Standard Deviation = 3/2 × Quartile deviation
The Q.D. of the daily wages (in Rs) of 7 persons given below: 12,7,15,10,17,19,25 is- a)4.5
- b)9
- c)5
- d)14.5
Correct answer is option 'A'. Can you explain this answer?
The Q.D. of the daily wages (in Rs) of 7 persons given below: 12,7,15,10,17,19,25 is
a)
4.5
b)
9
c)
5
d)
14.5
|
|
Arshiya Shah answered |
Q.D. of Daily Wages of 7 Persons
To find the Q.D. (Quartile Deviation) of the daily wages of 7 persons given below: 12, 7, 15, 10, 17, 19, 25, we need to follow the steps given below:
Step 1: Arrange the data in ascending order.
7, 10, 12, 15, 17, 19, 25
Step 2: Find the median or the second quartile (Q2) of the data.
Median of the data = (n + 1)/2-th value = (7 + 1)/2-th value = 4th value
Hence, median = 15
Step 3: Find the first quartile (Q1) of the data.
Q1 = (n + 1)/4-th value = (7 + 1)/4-th value = 2nd value
Hence, Q1 = 10
Step 4: Find the third quartile (Q3) of the data.
Q3 = 3(n + 1)/4-th value = 3(7 + 1)/4-th value = 6th value
Hence, Q3 = 19
Step 5: Calculate the Quartile Deviation (Q.D.) using the formula:
Q.D. = (Q3 - Q1)/2
Substituting the values of Q1 and Q3, we get:
Q.D. = (19 - 10)/2 = 4.5
Therefore, the Q.D. of the daily wages of 7 persons given is 4.5.
Note: Quartile deviation is a measure of dispersion that gives an idea about the spread of data around the median. It is calculated as half of the difference between the third and first quartiles.
If the two lines of regression of a bivariate distribution coincide, then the correlation coefficient ρρsatisfies.- a)ρ = 0
- b)ρ > 0
- c)ρ = 1 or −1
- d)ρ < 0
Correct answer is option 'C'. Can you explain this answer?
If the two lines of regression of a bivariate distribution coincide, then the correlation coefficient ρρsatisfies.
a)
ρ = 0
b)
ρ > 0
c)
ρ = 1 or −1
d)
ρ < 0
|
|
Naina Bansal answered |
If the two lines of regression of a bivariate distribution coincide, it means that there is a perfect linear relationship between the two variables. This can happen in two cases:
The two variables are perfectly positively correlated, meaning that as one variable increases, the other variable also increases by a fixed amount. In this case, the correlation coefficient will be equal to 1.
The two variables are perfectly negatively correlated, meaning that as one variable increases, the other variable decreases by a fixed amount. In this case, the correlation coefficient will be equal to -1.
Therefore, if the two lines of regression of a bivariate distribution coincide, the correlation coefficient will be equal to 1 or -1.
The correct answer is therefore (c) ρ = 1 or −1.

The mean weight of a group of 10 items is 28 and that of another group of n items is 35.The mean of combined group of 10 + n items is found to be 30. The value of n is- a)12
- b)4
- c)10
- d)2
Correct answer is option 'B'. Can you explain this answer?
The mean weight of a group of 10 items is 28 and that of another group of n items is 35.The mean of combined group of 10 + n items is found to be 30. The value of n is
a)
12
b)
4
c)
10
d)
2
|
|
Prisha Chauhan answered |
Given Information:
- Mean weight of a group of 10 items = 28
- Mean weight of another group of n items = 35
- Mean weight of combined group of 10+n items = 30
To find: value of n
Mean Formula:
Mean = (Sum of all values) / (Number of values)
Approach:
Let's first find the sum of weights of two groups separately.
Total sum of weights of 10 items = 28 × 10 = 280
Total sum of weights of n items = 35n
Now, let's find the total sum of weights of combined groups using the mean formula.
Total sum of weights of 10+n items = 30 × (10+n) = 300 + 30n
We can now form the following equation by adding the sum of two groups:
280 + 35n = 300 + 30n
Simplifying the above equation, we get:
5n = 20
n = 4
Therefore, the value of n is 4.
Answer: Option B

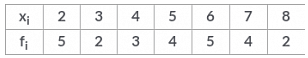
The standard deviation for the following data:

- a)5
- b)4.21
- c)3.12
- d)None of the above
Correct answer is option 'C'. Can you explain this answer?
The standard deviation for the following data:
a)
5
b)
4.21
c)
3.12
d)
None of the above
|
|
Neha Sharma answered |
Answer: C
Solution: Variance= [summation (y^2×f) /N] -[ summation (yf) /N]^2
=(296/25) -(0/25) ^2
=11.84
standard deviation=√11.84=3.12
Solution: Variance= [summation (y^2×f) /N] -[ summation (yf) /N]^2
=(296/25) -(0/25) ^2
=11.84
standard deviation=√11.84=3.12
A man tavels at a speed of 20 km/hour and then return at a speed of 30 km/hour. His average speed of the whole journey is- a)24 km/hour
- b)26 km/hour
- c)25 km/hour
- d)24.5 km/hour
Correct answer is option 'A'. Can you explain this answer?
A man tavels at a speed of 20 km/hour and then return at a speed of 30 km/hour. His average speed of the whole journey is
a)
24 km/hour
b)
26 km/hour
c)
25 km/hour
d)
24.5 km/hour
|
|
Nabanita Bajaj answered |
Solution:
The average speed of the whole journey is given by the formula:
Average speed = Total distance / Total time
Let's assume that the distance travelled by the man in one direction is 'd' km.
Therefore, the total distance travelled by the man in the whole journey is 2d km.
Let's also assume that the time taken by the man to travel 'd' km at a speed of 20 km/hour is 't1' hours.
Therefore, the time taken by the man to travel 'd' km at a speed of 30 km/hour is 't2' hours.
Using the formula:
Time = Distance / Speed
We can write:
t1 = d / 20 and t2 = d / 30
Therefore, the total time taken by the man in the whole journey is:
Total time = t1 + t2 = d / 20 + d / 30 = (3d + 2d) / (60) = 5d / 60 = d / 12 hours
Using the formula for average speed, we get:
Average speed = Total distance / Total time
= 2d / (d / 12)
= 24 km/hour
Therefore, the correct answer is option 'A' - 24 km/hour.
If x and y are related as y – 4x = 3, then the nature of correlation between x and y is- a)perfect negative
- b)no correlation
- c)perfect positive
- d)none of these
Correct answer is option 'C'. Can you explain this answer?
If x and y are related as y – 4x = 3, then the nature of correlation between x and y is
a)
perfect negative
b)
no correlation
c)
perfect positive
d)
none of these
|
|
Rohan Singh answered |
Positive correlation is a relationship between two variables in which both variables move in tandem. A positive correlation exists when one variable decreases as the other variable decreases, or one variable increases while the other increases.
The two lines of regression are x + 4y = 3 and 3x +y = 15. value of x for y = 3 is- a)- 4
- b)4
- c)- 9
- d)none of these
Correct answer is option 'B'. Can you explain this answer?
The two lines of regression are x + 4y = 3 and 3x +y = 15. value of x for y = 3 is
a)
- 4
b)
4
c)
- 9
d)
none of these

|
Pragati Nair answered |
We have x + 4y = 3 and 3x + y = 15 as the lines of regression of y on x and x on y respectively.
Therefore, for y = 3 the required line is x on y
so put y= 3 in 3x + y = 15
we get, x = 4
Therefore, for y = 3 the required line is x on y
so put y= 3 in 3x + y = 15
we get, x = 4
The arithmetic mean of the numerical values of the deviations of items from some average value is called the- a)Standard deviation
- b)Range
- c)Quartile deviation
- d)Mean deviation
Correct answer is option 'D'. Can you explain this answer?
The arithmetic mean of the numerical values of the deviations of items from some average value is called the
a)
Standard deviation
b)
Range
c)
Quartile deviation
d)
Mean deviation
|
|
Maulik Majumdar answered |
Mean deviation of a data set is the average of the absolute deviations from a central point (Average value).
If the mean of the squares of first n natural numbers be 11, then n is equal to- a)13
- b)5
- c)- 13/2
- d)11
Correct answer is option 'B'. Can you explain this answer?
If the mean of the squares of first n natural numbers be 11, then n is equal to
a)
13
b)
5
c)
- 13/2
d)
11
|
|
Tarun Roy answered |
**Given information:**
The mean of the squares of the first n natural numbers is 11.
**To find:**
The value of n.
**Solution:**
Let's first calculate the sum of the squares of the first n natural numbers.
The sum of the squares of the first n natural numbers can be calculated using the formula:
Sum = n(n+1)(2n+1)/6
Now, we are given that the mean of these squares is 11.
Mean = Sum/n
Substituting the value of Sum, we get:
11 = n(n+1)(2n+1)/6n
Simplifying further, we get:
11 = (n+1)(2n+1)/6
Multiplying both sides by 6, we get:
66 = (n+1)(2n+1)
Expanding the equation, we get:
66 = 2n^2 + 3n + n + 1
Rearranging the equation, we get:
2n^2 + 4n - 65 = 0
Now, we can solve this quadratic equation for n using factorization or the quadratic formula.
By factoring, we can write:
2n^2 + 4n - 65 = 0
(n + 13)(2n - 5) = 0
So, n can be either -13/2 or 5.
Since n represents the number of natural numbers, it cannot be a negative or fractional value. Therefore, the only valid solution is n = 5.
Hence, the correct answer is option B.
An analysis of monthly wages paid to workers in two firms A and B, belonging to the same industry, gives the following results: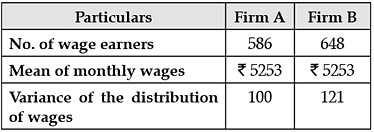
 Q. Coefficient of variation of the distribution of wages for firm A
- a)0.15
- b)0.19
- c)0.21
- d)0.24
Correct answer is option 'B'. Can you explain this answer?
An analysis of monthly wages paid to workers in two firms A and B, belonging to the same industry, gives the following results:
Q. Coefficient of variation of the distribution of wages for firm A
a)
0.15
b)
0.19
c)
0.21
d)
0.24
|
|
Raghav Bansal answered |
Variance of distribution of wages,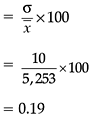
σ2 = 100
Standard deviation, σ = √σ2
= √100
= 10
coefficient of Variation
An analysis of monthly wages paid to workers in two firms A and B, belonging to the same industry, gives the following results:
 Q. Which firm A or B shows greater variability in individual wages?
- a)Firm B
- b)Firm A
- c)Both
- d)Can’t Say
Correct answer is option 'A'. Can you explain this answer?
An analysis of monthly wages paid to workers in two firms A and B, belonging to the same industry, gives the following results:
Q. Which firm A or B shows greater variability in individual wages?
a)
Firm B
b)
Firm A
c)
Both
d)
Can’t Say
|
|
Geetika Shah answered |
Coefficient of variation of wages, of firm A = 0.19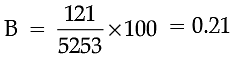
coefficient of variation of wages, of firm
∴ Firm B shows greater variability in individual wages.
A teacher conducted a surprise test of Mathematics, Physics and Chemistry for class XI on Monday.The mean and standard deviation of marks obtained by 50 students of the class in three subjects are given below:
 Q. What is the coefficient of variation of marks obtained by the students in Physics?
- a)28.57
- b)46.87
- c)48.89
- d)none of these
Correct answer is option 'B'. Can you explain this answer?
A teacher conducted a surprise test of Mathematics, Physics and Chemistry for class XI on Monday.
The mean and standard deviation of marks obtained by 50 students of the class in three subjects are given below:
Q. What is the coefficient of variation of marks obtained by the students in Physics?
a)
28.57
b)
46.87
c)
48.89
d)
none of these
|
|
Tanuja Kapoor answered |
Standard deviation of Physics = 15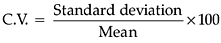
The coefficient of variation,
C.V. (in Physics) = 15/32 × 100 = 46.87
A teacher conducted a surprise test of Mathematics, Physics and Chemistry for class XI on Monday.The mean and standard deviation of marks obtained by 50 students of the class in three subjects are given below:
 Q. What is the coefficient of variation of marks obtained by the students in Chemistry?
- a)28.57
- b)46.87
- c)48.89
- d)none of these
Correct answer is option 'C'. Can you explain this answer?
A teacher conducted a surprise test of Mathematics, Physics and Chemistry for class XI on Monday.
The mean and standard deviation of marks obtained by 50 students of the class in three subjects are given below:
Q. What is the coefficient of variation of marks obtained by the students in Chemistry?
a)
28.57
b)
46.87
c)
48.89
d)
none of these
|
|
Ananya Das answered |
Standard deviation of Chemistry = 20
C.V. (in Chemistry) = 20/40.9 x 100 = 48.89
If the median = (mode + 2 mean) μ, then μ is equal to- a)3
- b)1/3
- c)2/3
- d)2
Correct answer is option 'B'. Can you explain this answer?
If the median = (mode + 2 mean) μ, then μ is equal to
a)
3
b)
1/3
c)
2/3
d)
2
|
|
Muskaan Singh answered |
If the median equals the mode plus twice the mean, we can express this relationship mathematically as:
Median = Mode + 2 * Mean
Median = Mode + 2 * Mean
If the mean of the first n odd natural numbers be n itself, then n is equal to- a)3
- b)any natural number
- c)2
- d)1
Correct answer is option 'B'. Can you explain this answer?
If the mean of the first n odd natural numbers be n itself, then n is equal to
a)
3
b)
any natural number
c)
2
d)
1
|
|
Ujwal Ghosh answered |
The Mean of the First n Odd Natural Numbers
To solve this problem, we need to find the value of n for which the mean of the first n odd natural numbers is equal to n itself.
Understanding the Mean
The mean of a set of numbers is calculated by adding up all the numbers in the set and then dividing the sum by the total number of values in the set.
Calculating the Mean of Odd Natural Numbers
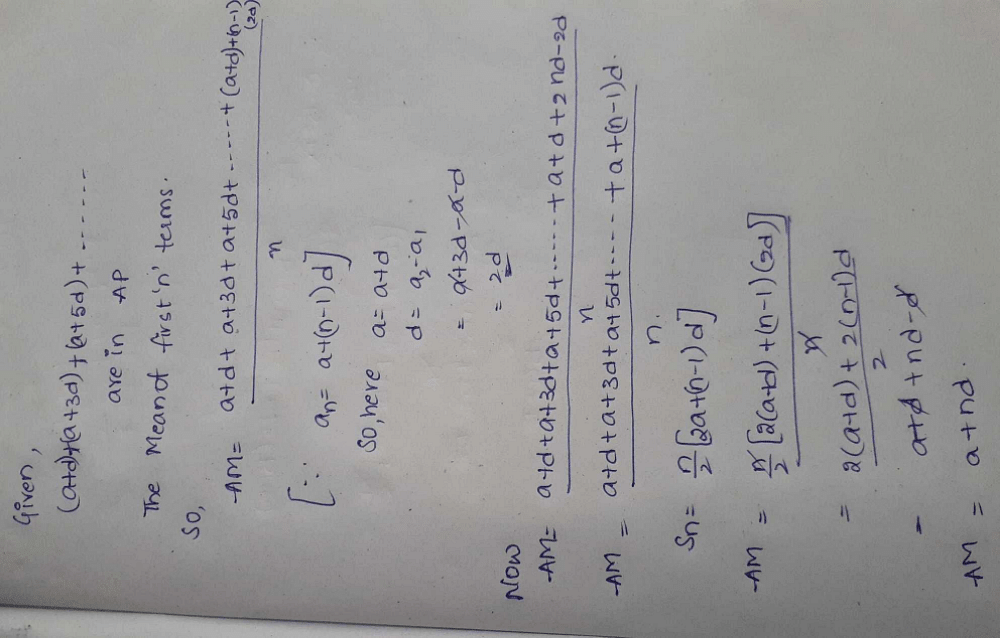
The first n odd natural numbers can be written as 1, 3, 5, 7, ..., (2n-1). To find their mean, we add up all these numbers and divide by n.
Sum of the first n odd natural numbers = 1 + 3 + 5 + 7 + ... + (2n-1)
To calculate the sum of an arithmetic series, we use the formula: Sn = (n/2)(a + l), where Sn is the sum of the series, n is the number of terms, a is the first term, and l is the last term.
In this case, the first term is 1 and the last term is (2n-1). So, the sum of the first n odd natural numbers can be represented as:
Sn = (n/2)(1 + (2n-1))
Simplifying the expression:
Sn = (n/2)(1 + 2n - 1)
= (n/2)(2n)
= n^2
The mean of the first n odd natural numbers is given by:
Mean = Sn/n = n^2/n = n
Determining the Value of n
According to the given condition, the mean of the first n odd natural numbers is equal to n itself. Therefore, we have:
n = n
This equation holds true for all natural numbers. Hence, the correct answer is option B - any natural number.
Conclusion
The mean of the first n odd natural numbers is equal to n itself for any natural number. This can be mathematically proven by calculating the sum of the series and dividing it by n. Therefore, the correct answer to the given question is option B.
To solve this problem, we need to find the value of n for which the mean of the first n odd natural numbers is equal to n itself.
Understanding the Mean
The mean of a set of numbers is calculated by adding up all the numbers in the set and then dividing the sum by the total number of values in the set.
Calculating the Mean of Odd Natural Numbers
The first n odd natural numbers can be written as 1, 3, 5, 7, ..., (2n-1). To find their mean, we add up all these numbers and divide by n.
Sum of the first n odd natural numbers = 1 + 3 + 5 + 7 + ... + (2n-1)
To calculate the sum of an arithmetic series, we use the formula: Sn = (n/2)(a + l), where Sn is the sum of the series, n is the number of terms, a is the first term, and l is the last term.
In this case, the first term is 1 and the last term is (2n-1). So, the sum of the first n odd natural numbers can be represented as:
Sn = (n/2)(1 + (2n-1))
Simplifying the expression:
Sn = (n/2)(1 + 2n - 1)
= (n/2)(2n)
= n^2
The mean of the first n odd natural numbers is given by:
Mean = Sn/n = n^2/n = n
Determining the Value of n
According to the given condition, the mean of the first n odd natural numbers is equal to n itself. Therefore, we have:
n = n
This equation holds true for all natural numbers. Hence, the correct answer is option B - any natural number.
Conclusion
The mean of the first n odd natural numbers is equal to n itself for any natural number. This can be mathematically proven by calculating the sum of the series and dividing it by n. Therefore, the correct answer to the given question is option B.
An analysis of monthly wages paid to workers in two firms A and B, belonging to the same industry, gives the following results:
 Q. Amount paid by firm B is
- a)3078258
- b)3043944
- c)3708258
- d)3403944
Correct answer is option 'D'. Can you explain this answer?
An analysis of monthly wages paid to workers in two firms A and B, belonging to the same industry, gives the following results:
Q. Amount paid by firm B is
a)
3078258
b)
3043944
c)
3708258
d)
3403944
|
|
Geetika Shah answered |
No. of wage earners = 648
Mean of monthly wages, x = ₹5253
Amount paid by firm B = 648 × 5253
= ₹3403944
If the two lines of regression are at right angles, then ρ(X,Y) is equal to- a)- 1
- b)0
- c)1
- d)1 or - 1
Correct answer is option 'B'. Can you explain this answer?
If the two lines of regression are at right angles, then ρ(X,Y) is equal to
a)
- 1
b)
0
c)
1
d)
1 or - 1
|
|
Nabanita Bajaj answered |
Understanding Regression Lines and Correlation
When two lines of regression are at right angles, it provides critical information about the relationship between the variables X and Y.
Correlation Coefficient (ρ)
- The correlation coefficient (ρ) quantifies the degree of linear relationship between two variables.
- Its value ranges from -1 to +1:
- ρ = 1 indicates a perfect positive correlation.
- ρ = -1 indicates a perfect negative correlation.
- ρ = 0 indicates no correlation.
Right Angles and Independence
- Lines of regression are perpendicular (at right angles) when the product of their slopes equals -1.
- This condition signifies that changes in one variable do not predict changes in the other, indicating independence.
Conclusion: The Value of ρ
- When the lines of regression are at right angles, it implies that:
- There is no linear relationship between X and Y.
- Thus, ρ must equal 0.
This leads us to conclude that the correct answer to the question is option 'B', which states that ρ(X,Y) is equal to 0.
If the mean of 3,4,x,7,10, is 6, then the value of x is- a)7
- b)5
- c)4
- d)6
Correct answer is option 'D'. Can you explain this answer?
If the mean of 3,4,x,7,10, is 6, then the value of x is
a)
7
b)
5
c)
4
d)
6
|
|
Tanishq Singh answered |
Question:
If the mean of 3, 4, x, 7, 10 is 6, then the value of x is
Answer:
To find the value of x, we need to use the formula for the mean, which is the sum of all the numbers divided by the total number of numbers.
The formula for the mean is:
mean = (3 + 4 + x + 7 + 10)/5
Given that the mean is 6, we can substitute this value into the formula and solve for x:
6 = (3 + 4 + x + 7 + 10)/5
Simplifying the equation:
To simplify the equation, we can start by multiplying both sides of the equation by 5 to eliminate the fraction:
6 * 5 = (3 + 4 + x + 7 + 10)
30 = 3 + 4 + x + 7 + 10
Now, we can combine like terms on the right side of the equation:
30 = 24 + x
Next, we can isolate the variable x by subtracting 24 from both sides of the equation:
30 - 24 = x
6 = x
Conclusion:
Therefore, the value of x is 6. Hence, the correct answer is option D.
If the angle between two lines of regression is 900, then it represents- a)no linear correlation
- b)perfect positive correlation
- c)perfect negative correlation
- d)none of these
Correct answer is option 'A'. Can you explain this answer?
If the angle between two lines of regression is 900, then it represents
a)
no linear correlation
b)
perfect positive correlation
c)
perfect negative correlation
d)
none of these
|
|
Disha Bajaj answered |
Explanation:
When we talk about the angle between two lines of regression, we are referring to the angle between the regression lines of two variables in a scatter plot. The regression line represents the best fit line that minimizes the sum of squared residuals.
No Linear Correlation:
If the angle between the two lines of regression is 90°, it indicates that there is no linear correlation between the variables. In other words, the variables are not related to each other in a linear manner. This can happen when the data points are scattered randomly and do not follow any clear pattern or trend.
Perfect Positive Correlation:
If the angle between the two lines of regression is 0°, it represents a perfect positive correlation between the variables. This means that as one variable increases, the other variable also increases in a linear manner. The data points lie close to the regression line, indicating a strong positive relationship.
Perfect Negative Correlation:
If the angle between the two lines of regression is 180°, it represents a perfect negative correlation between the variables. This means that as one variable increases, the other variable decreases in a linear manner. The data points lie close to the regression line, indicating a strong negative relationship.
Explanation of the Correct Answer:
In this case, the angle between the two lines of regression is given as 90°. Since the angle is not 0° (perfect positive correlation) or 180° (perfect negative correlation), it indicates that there is no linear correlation between the variables. The data points are scattered randomly, and there is no clear relationship between them.
Therefore, the correct answer is option 'A' - no linear correlation.
If the mean of numbers 27,31,89,107,156 is 82, then the mean of 130,126,68,50,1 is :- a)75
- b)82
- c)80
- d)157
Correct answer is option 'A'. Can you explain this answer?
If the mean of numbers 27,31,89,107,156 is 82, then the mean of 130,126,68,50,1 is :
a)
75
b)
82
c)
80
d)
157
|
|
Disha Bajaj answered |
To find the mean of a set of numbers, we add up all the numbers and then divide the sum by the total count of numbers.
Finding the mean of the first set of numbers:
27 + 31 + 89 + 107 + 156 = 410
The count of numbers in the first set is 5.
Mean = 410 / 5 = 82
Now, we need to find the mean of the second set of numbers using the given mean of the first set.
Finding the sum of the second set of numbers:
130 + 126 + 68 + 50 + 1 = 375
Finding the count of numbers in the second set:
There are 5 numbers in the second set.
Let's assume the mean of the second set is x.
Now, we can write the equation:
(410 + 375) / (5 + 5) = x
Simplifying the equation:
785 / 10 = x
x = 78.5
So, the mean of the second set of numbers is 78.5, which is closest to option A) 75.
Therefore, the correct answer is option A) 75.
Which one of the following average is most affected of extreme observations ?- a)Median
- b)Mode
- c)G.M.
- d)A. M.
Correct answer is option 'D'. Can you explain this answer?
Which one of the following average is most affected of extreme observations ?
a)
Median
b)
Mode
c)
G.M.
d)
A. M.
|
|
Mansi Menon answered |
Introduction:
The question asks us to identify which average is most affected by extreme observations. We have four options to choose from: Median, Mode, Geometric Mean (G.M.), and Arithmetic Mean (A.M.).
Explanation:
To determine which average is most affected by extreme observations, we need to understand how each average is calculated and how extreme observations can impact them.
Median:
The median is the middle value in a set of data when the data is arranged in ascending or descending order. If there is an odd number of observations, the median is the middle value. If there is an even number of observations, the median is the average of the two middle values.
Extreme observations have minimal impact on the median. Even if there are extremely high or low values, the median will remain relatively unchanged as long as they are not in the middle position. Therefore, we can eliminate option (a) Median as the correct answer.
Mode:
The mode is the value or values that appear most frequently in a set of data. Extreme observations have no impact on the mode unless they are the most frequently occurring values. Since extreme observations do not necessarily affect the mode, we can eliminate option (b) Mode as the correct answer.
Geometric Mean (G.M.):
The geometric mean is the nth root of the product of n numbers. Extreme observations can significantly affect the geometric mean, especially if they are large or small values. The product of extreme values will dominate the overall calculation, leading to a higher or lower geometric mean. Therefore, option (c) G.M. is also eliminated as the correct answer.
Arithmetic Mean (A.M.):
The arithmetic mean is calculated by summing all the values in a set of data and dividing by the number of observations. Extreme observations can have a significant impact on the arithmetic mean, especially if they are large or small values. Adding extreme values to the sum will increase or decrease the overall calculation, leading to a higher or lower arithmetic mean. Therefore, option (d) A.M. is the correct answer.
Conclusion:
After analyzing the impact of extreme observations on each average, we can conclude that the arithmetic mean (A.M.) is the average that is most affected by extreme observations. Extreme values have minimal impact on the median and mode, but they can significantly affect the geometric mean and arithmetic mean.
S.D. of a data is 6. When each observation is increased by 1, then the S.D. of new data is- a)8
- b)6
- c)5
- d)7
Correct answer is option 'B'. Can you explain this answer?
S.D. of a data is 6. When each observation is increased by 1, then the S.D. of new data is
a)
8
b)
6
c)
5
d)
7
|
|
Disha Bajaj answered |
Given:
Standard deviation (SD) of a data = 6
To find:
SD of the new data when each observation is increased by 1
Solution:
When each observation in a data set is increased by a constant value, the mean of the data set also increases by that constant value. However, the standard deviation remains unchanged.
Explanation:
Let's consider a data set with n observations: {x1, x2, x3, ..., xn}
The mean of this data set is given by:
Mean = (x1 + x2 + x3 + ... + xn) / n
When each observation is increased by 1, the new data set becomes: {x1 + 1, x2 + 1, x3 + 1, ..., xn + 1}
The mean of the new data set is given by:
New Mean = [(x1 + 1) + (x2 + 1) + (x3 + 1) + ... + (xn + 1)] / n
To find the standard deviation, we need to calculate the sum of squares of the differences between each observation and the mean, and then take the square root of the average of these squared differences.
Calculation of Standard Deviation:
SD = sqrt[((x1 - Mean)^2 + (x2 - Mean)^2 + (x3 - Mean)^2 + ... + (xn - Mean)^2) / n]
Similarly, for the new data set:
New SD = sqrt[((x1 + 1 - New Mean)^2 + (x2 + 1 - New Mean)^2 + (x3 + 1 - New Mean)^2 + ... + (xn + 1 - New Mean)^2) / n]
Comparison:
We know that the mean of the new data set is increased by 1 compared to the original mean.
New Mean = Mean + 1
Substituting this into the equation for New SD, we get:
New SD = sqrt[((x1 + 1 - (Mean + 1))^2 + (x2 + 1 - (Mean + 1))^2 + (x3 + 1 - (Mean + 1))^2 + ... + (xn + 1 - (Mean + 1))^2) / n]
= sqrt[((x1 - Mean)^2 + (x2 - Mean)^2 + (x3 - Mean)^2 + ... + (xn - Mean)^2) / n]
= SD
Hence, the standard deviation of the new data set remains unchanged, which is equal to the standard deviation of the original data set.
Therefore, the SD of the new data is 6, which is the same as the original SD.
Hence, option B is the correct answer.
A teacher conducted a surprise test of Mathematics, Physics and Chemistry for class XI on Monday.The mean and standard deviation of marks obtained by 50 students of the class in three subjects are given below: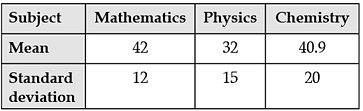
 Q. Which of the three subjects shows the highest variability?
- a)Mathematics
- b)Physics
- c)Chemistry
- d)none of these
Correct answer is option 'C'. Can you explain this answer?
A teacher conducted a surprise test of Mathematics, Physics and Chemistry for class XI on Monday.
The mean and standard deviation of marks obtained by 50 students of the class in three subjects are given below:
a)
Mathematics
b)
Physics
c)
Chemistry
d)
none of these
|
|
Tanuja Kapoor answered |
The subject with greater C.V. is more variable than others. Therefore, the highest variability in marks is in Chemistry.
A group of 10 items has mean 6. If the mean of 4 of these items is 7.5, then the mean of the remaining items is- a)5.5
- b)5.0
- c)6.5
- d)4.5
Correct answer is option 'B'. Can you explain this answer?
A group of 10 items has mean 6. If the mean of 4 of these items is 7.5, then the mean of the remaining items is
a)
5.5
b)
5.0
c)
6.5
d)
4.5

|
Anand Khanna answered |
Total of 10 items = 6 x 10 =60
Total of 4 items = 4 x 7.5 =30
=> Total of remaining 6 items = 60−30 =30
Mean = 306 =5
Ans : (B)
Mean deviation from the mean for the observations – 1, 0 ,4 is- a)2/3
- b)3/2
- c)2
- d)none of these
Correct answer is option 'C'. Can you explain this answer?
Mean deviation from the mean for the observations – 1, 0 ,4 is
a)
2/3
b)
3/2
c)
2
d)
none of these
|
|
Bhargavi Bose answered |
To calculate the mean deviation from the mean for a set of observations, follow these steps:
1. Calculate the mean of the observations by adding all the values together and dividing by the total number of observations.
2. Subtract the mean from each individual observation to find the deviation from the mean.
3. Take the absolute value of each deviation to ensure that negative values do not cancel out positive values.
4. Add up all the absolute deviations.
5. Divide the sum of the absolute deviations by the total number of observations to find the mean deviation from the mean.
Here is an example:
Observations: 5, 7, 9, 12, 15
1. Mean = (5 + 7 + 9 + 12 + 15) / 5 = 9.6
2. Deviations from the mean: -4.6, -2.6, -0.6, 2.4, 5.4
3. Absolute deviations: 4.6, 2.6, 0.6, 2.4, 5.4
4. Sum of absolute deviations: 15.6
5. Mean deviation from the mean = 15.6 / 5 = 3.12
Therefore, the mean deviation from the mean for these observations is 3.12.

Chapter doubts & questions for Statistics - Mathematics (Maths) Class 11 2024 is part of Commerce exam preparation. The chapters have been prepared according to the Commerce exam syllabus. The Chapter doubts & questions, notes, tests & MCQs are made for Commerce 2024 Exam. Find important definitions, questions, notes, meanings, examples, exercises, MCQs and online tests here.
Chapter doubts & questions of Statistics - Mathematics (Maths) Class 11 in English & Hindi are available as part of Commerce exam.
Download more important topics, notes, lectures and mock test series for Commerce Exam by signing up for free.
Mathematics (Maths) Class 11
75 videos|238 docs|91 tests
|
Signup to see your scores go up within 7 days!
Study with 1000+ FREE Docs, Videos & Tests
10M+ students study on EduRev
|
© EduRev
|
Education Revolution
|


Follow Us
|


Signup to see your scores
go up
within 7 days!
within 7 days!
Takes less than 10 seconds to signup