Bank Exams Exam  >  Bank Exams Tests  >  Data Interpretation for Competitive Examinations  >  MCQ Test: Missing Data Interpretation - 1 - Bank Exams MCQ

MCQ Test: Missing Data Interpretation - 1 - Bank Exams MCQ


Test Description

20 Questions MCQ Test Data Interpretation for Competitive Examinations - MCQ Test: Missing Data Interpretation - 1

MCQ Test: Missing Data Interpretation - 1 for Bank Exams 2024 is part of Data Interpretation for Competitive Examinations preparation. The MCQ Test: Missing Data Interpretation - 1 questions and answers have been prepared according to the Bank Exams exam syllabus.The MCQ Test: Missing Data Interpretation - 1 MCQs are made for Bank Exams 2024 Exam. Find important definitions, questions, notes, meanings, examples, exercises, MCQs and online tests for MCQ Test: Missing Data Interpretation - 1 below.
Solutions of MCQ Test: Missing Data Interpretation - 1 questions in English are available as part of our Data Interpretation for Competitive Examinations for Bank Exams & MCQ Test: Missing Data Interpretation - 1 solutions in Hindi for Data Interpretation for Competitive Examinations course. Download more important topics, notes, lectures and mock test series for Bank Exams Exam by signing up for free. Attempt MCQ Test: Missing Data Interpretation - 1 | 20 questions in 20 minutes | Mock test for Bank Exams preparation | Free important questions MCQ to study Data Interpretation for Competitive Examinations for Bank Exams Exam | Download free PDF with solutions
MCQ Test: Missing Data Interpretation - 1 - Question 1

Directions: Study the following information carefully and answer the given questions:

The given table shows the number of three different color balls in four different boxes.

Q. The average number of blue balls in all the boxes together is 15 and the number of blue balls in B is equal the number of red balls in box D. What is the average number of balls in D?

Detailed Solution for MCQ Test: Missing Data Interpretation - 1 - Question 1

Total number of blue balls = 15 * 4 = 60

Number of blue balls in B = 60 – 10 – 15 – 20 = 15

Average number of balls in D = (10 + 20 + 15)/3 = 15

MCQ Test: Missing Data Interpretation - 1 - Question 2

Directions: Study the following information carefully and answer the given questions:

The given table shows the number of three different color balls in four different boxes.

Q. Ratio of the number of red balls in B and D is 2:1 and average number of balls in box B is 25. If the total number of red balls in all the boxes together is 75, what is the number of blue balls in box B?

Detailed Solution for MCQ Test: Missing Data Interpretation - 1 - Question 2

Red balls = 75

Number of red balls in B and D = 75 – 15 – 30 = 30

Number red balls in B = 2/3 * 30 = 20

Total number of red balls in box B = 25 * 3 = 75

Number of blue balls in B = 75 – 20 – 20 = 35

1 Crore+ students have signed up on EduRev. Have you? Download the App
MCQ Test: Missing Data Interpretation - 1 - Question 3

Directions: Study the following information carefully and answer the given questions:

The given table shows the number of three different color balls in four different boxes.

Q. Total number of balls in box D is 45 and the ratio of the number of red balls in D to the number of yellow balls in A is 3:4. What is the total number of balls in A?

Detailed Solution for MCQ Test: Missing Data Interpretation - 1 - Question 3

Number of red balls in D = 45 – 10 – 20 = 15

Number of yellow balls in A = 4/3 * 15 = 20

Total number of balls in A = 20 + 15 + 10 = 45

MCQ Test: Missing Data Interpretation - 1 - Question 4

Directions: Study the following information carefully and answer the given questions:

The given table shows the number of three different color balls in four different boxes.

Q. Average number of balls in C is 21 and the average number of yellow balls in all the boxes together is 15. What is the ratio of the number of yellow balls in A to the number of blue balls in D?

Detailed Solution for MCQ Test: Missing Data Interpretation - 1 - Question 4

Total number balls in C = 21 * 3 = 63

Yellow balls in C = 63 – 30 – 15 = 18

Total number of yellow balls = 15 * 4 = 60

Yellow balls in A = 60 – 20 – 18 – 10 = 12

Number of blue balls in D = 20

Required ratio = 12 : 20 = 3 : 5

MCQ Test: Missing Data Interpretation - 1 - Question 5

Directions: Study the following information carefully and answer the given questions:

The given table shows the number of three different color balls in four different boxes.

Q. Total number of balls in all the boxes together is 200. Ratio of the total number of balls in A, B, C and D is 9 : 9 : 13 : 9 and ratio of the red and blue balls in B is 2 : 3. What is the ratio of the number of yellow balls in A and C together to the number of red balls in B and D together?

Detailed Solution for MCQ Test: Missing Data Interpretation - 1 - Question 5

Total number of balls in A = 9/40 * 200 = 45

Number of yellow balls in A = 45 – 15 – 10 = 20

Total number of balls in C = 13/40 * 200 = 65

Number of yellow balls in C = 65 – 30 – 15 = 20

Total number balls in B = 9/40 * 200 = 45

Number of red balls in B = 2/5 * (45 – 20) = 10

Total number of balls in D = 9/40 * 200 = 45

Number of red balls in D = 45 – 10 – 20 = 15

Required ratio = (20 + 20):(10 + 15)

= 40 : 25

= 8 : 5

MCQ Test: Missing Data Interpretation - 1 - Question 6

Directions: Study the following table chart carefully and answer the questions given beside.
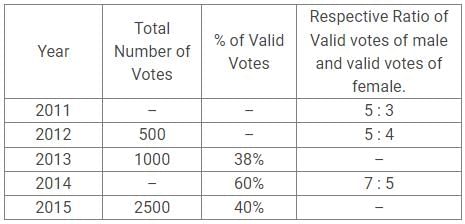
Q. In 2013, if the number of valid votes of female was 100, what was the respective ratio of number of valid votes of male and number of valid votes of female in the same year?

Detailed Solution for MCQ Test: Missing Data Interpretation - 1 - Question 6

Total Valid votes = 38% of 1000 = 380
Valid votes of Female = 100
Valid votes of Male = 380 – 100 = 280
Respective ratio =  280 : 100
= 14 : 5

MCQ Test: Missing Data Interpretation - 1 - Question 7

Directions: Study the following table chart carefully and answer the questions given beside.
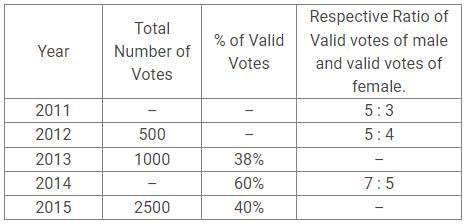
Q. In 2011, the respective ratio of total number of votes to valid votes was 5 : 4. Number of valid votes of female in 2011 constitutes what percent of the total number of votes in the same year?

Detailed Solution for MCQ Test: Missing Data Interpretation - 1 - Question 7

Respective ratio of total number of votes to valid votes = 5 : 4

Let the total number of votes = 10x

So the total number of valid votes = 8x

Valid votes of female in 2011 = 3x [As ratio of male to female valid votes is 5 : 3]

Hence, option D is correct.

MCQ Test: Missing Data Interpretation - 1 - Question 8

Directions: Study the following table chart carefully and answer the questions given beside.
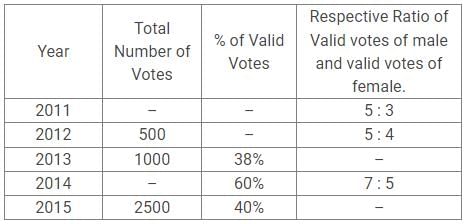
Q. The total number of votes increased by 50% from 2012 to 2016. If 16% of the votes were valid in 2016, what was the number of valid votes in 2016?

Detailed Solution for MCQ Test: Missing Data Interpretation - 1 - Question 8

50% of 500 = 250
 Total Number of Votes in 2016 = 500 + 250 = 750
 Hence total Number of Valid Votes in 2016 = 16% of 750 = 120

MCQ Test: Missing Data Interpretation - 1 - Question 9

Directions: Study the following table chart carefully and answer the questions given beside.
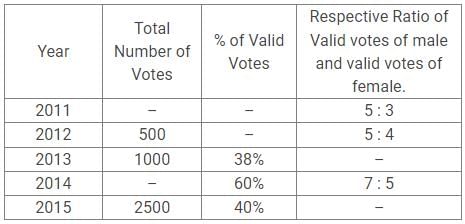
Q. If the average number of valid votes in 2012 and 2015 was 635,  what was the number of votes given by female in 2012?

Detailed Solution for MCQ Test: Missing Data Interpretation - 1 - Question 9

Total number of valid votes in 2012 and 2015 = 1270
The number of valid votes in 2015 = 40% of 2500 = 1000
So the number of valid votes in 2012 = 1270 – 1000 = 270
Votes given by female in 2012 = (4*270) / 9 = 120
Hence, option C is correct.

MCQ Test: Missing Data Interpretation - 1 - Question 10

Directions: Study the following table chart carefully and answer the questions given beside.
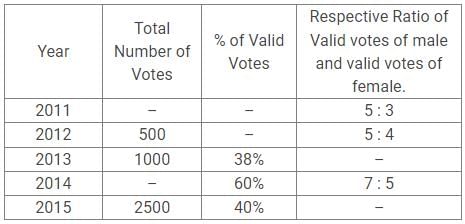
Q. In 2014, if the difference between number of valid votes of male and number of valid votes of female was 150, what was the total number of votes in 2014?

Detailed Solution for MCQ Test: Missing Data Interpretation - 1 - Question 10

Let, Valid Votes = 12x and  Total Votes = y

Valid votes by male = 7x

Valid votes by female = 5x

Difference between them = 7x - 5x = 2x = 150 (Given)

So, x = 75
Therefore, Valid votes = 12x = 900

60% of y = 900

y = 1500

Hence, option B is correct.

MCQ Test: Missing Data Interpretation - 1 - Question 11

Directions: Study the following information carefully and answer the questions given below.

The given table shows the number of students in four different colleges in four different departments.

Q. If the average number of ECE students from all the colleges together is 430 and the number of ECE students from D is equal to the number of ME students from A. What is the ratio of the number of ECE students from A to the number of CSE students from D?

Detailed Solution for MCQ Test: Missing Data Interpretation - 1 - Question 11

Total number of ECE students = 430 * 4 = 1720

Number of ECE students from D = 680

Number of ECE students from A = 1720 – 280 – 440 – 680 = 320

Required ratio = 320: 360 = 8: 9

MCQ Test: Missing Data Interpretation - 1 - Question 12

Directions: Study the following information carefully and answer the questions given below.

The given table shows the number of students in four different colleges in four different departments.

Q. If the total number of students from college A is equal to the total number of ME students from all the colleges together. The number of ECE students from college C is approximately what percent of the total number of students from college A all the departments together?

Detailed Solution for MCQ Test: Missing Data Interpretation - 1 - Question 12

Required percentage = 440/2000 * 100 = 22%

MCQ Test: Missing Data Interpretation - 1 - Question 13

Directions: Study the following information carefully and answer the questions given below.

The given table shows the number of students in four different colleges in four different departments.

Q. If the ratio of the number of ME students from B to C is 24 : 19, what is the number of CSE students from C?

Detailed Solution for MCQ Test: Missing Data Interpretation - 1 - Question 13

Number of ME students from B and C = 2000 – 680 – 460 = 860

Number of ME students from C = 19/43 * 860 = 380

Number of CSE students from C = 2000 – 540 – 440 – 380 = 640

MCQ Test: Missing Data Interpretation - 1 - Question 14

Directions: Study the following information carefully and answer the questions given below.

The given table shows the number of students in four different colleges in four different departments.

Q. Total number of EEE students from all the colleges together is 1900, then what is the number of ME students from B?

Detailed Solution for MCQ Test: Missing Data Interpretation - 1 - Question 14

Number of EEE students from B = 1900 – 440 – 540 – 560 = 360

Number of ME students from B = 1700 – 580 – 360 – 280 = 480

MCQ Test: Missing Data Interpretation - 1 - Question 15

Directions: Study the following information carefully and answer the questions given below.

The given table shows the number of students in four different colleges in four different departments.

Q. If the ratio of the number of students of CSE from A to C is 21:32, find the number of ME students from C?

Detailed Solution for MCQ Test: Missing Data Interpretation - 1 - Question 15

Total number of CSE students =2000

Number of CSE students from A and C = 2000 – 580 – 360 = 1060

Number of CSE students from C = 32/53 * 1060 = 640

Number of ME students from C = 2000 – 640 – 540 – 440 = 380

MCQ Test: Missing Data Interpretation - 1 - Question 16

Directions: Read the following table chart carefully and answer the questions given beside.

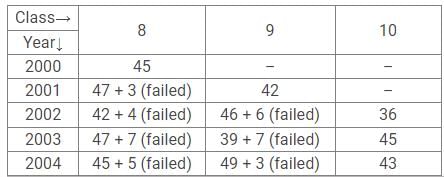
The following table shows the number of students in classes 8, 9 and 10 in a school. The school started in 2000 and students are admitted only in class 8. At the end of the year the students who pass the final exams get promoted to the next class while the students who fail stay in the same class and are joined by a new bunch of students, who are either promoted (class 9 and 10) or who joined the school new (class 8). All students who pass the class 10 exams pass out of the school.
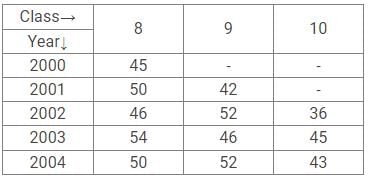
No student in class 10 failed in any of the years and no student failed in the same class more than once.

Q. How many students joined the school from 2000 to 2004?

Detailed Solution for MCQ Test: Missing Data Interpretation - 1 - Question 16

Following the common explanation, we get

The number of students who joined the school = 45 + 47 + 42 + 47 + 45 = 226

Hence, option C is correct.

Common explanation:

As it is given that a student who passes the final exams gets promoted to the next class, we can see that only 42 of the 45 students in class 8 in the year 2000, reached class 9, which means that 3 students had failed in the class that year. As the number of students in class 8 in 2001 is 50, 47 new students (50-3 failed students) joined class 8 in that year. In 2002, 36 students passed out of class 10, which means of the 42 students in class 9 in 2001, only 36 passed and 6 failed. This six students will remain in class 9 in 2002 also and as these are 52 students in class 9 in that year, 46 students were newly promoted, i.e, of the 50 students in class 8 in 2001.
 Similarly, we can find values for other years.

MCQ Test: Missing Data Interpretation - 1 - Question 17

Directions: Read the following table chart carefully and answer the questions given beside.

The following table shows the number of students in classes 8, 9 and 10 in a school. The school started in 2000 and students are admitted only in class 8. At the end of the year the students who pass the final exams get promoted to the next class while the students who fail stay in the same class and are joined by a new bunch of students, who are either promoted (class 9 and 10) or who joined the school new (class 8). All students who pass the class 10 exams pass out of the school.
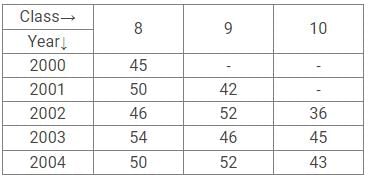
No student in class 10 failed in any of the years and no student failed in the same class more than once.

Q. What percentage of the students who joined the school from 2000 to 2002, passed out of the school by 2003?

Detailed Solution for MCQ Test: Missing Data Interpretation - 1 - Question 17

Following the common explanation, we get
Number of students who joined from 2000 to 2002 = (45 + 47 + 42) = 134
Number of students who passed only by 2003 = (36 + 45) = 81

Hence, option B is correct.

Common explanation:

As it is given that a student who passes the final exams gets promoted to the next class, we can see that only 42 of the 45 students in class 8 in the year 2000, reached class 9, which means that 3 students had failed in the class that year. As the number of students in class 8 in 2001 is 50, 47 new students (50-3 failed students) joined class 8 in that year. In 2002, 36 students passed out of class 10, which means of the 42 students in class 9 in 2001, only 36 passed and 6 failed. This six students will remain in class 9 in 2002 also and as these are 52 students in class 9 in that year, 46 students were newly promoted, i.e, of the 50 students in class 8 in 2001.
 Similarly, we can find values for other years.

MCQ Test: Missing Data Interpretation - 1 - Question 18

Directions: Read the following table chart carefully and answer the questions given beside.

The following table shows the number of students in classes 8, 9 and 10 in a school. The school started in 2000 and students are admitted only in class 8. At the end of the year the students who pass the final exams get promoted to the next class while the students who fail stay in the same class and are joined by a new bunch of students, who are either promoted (class 9 and 10) or who joined the school new (class 8). All students who pass the class 10 exams pass out of the school.
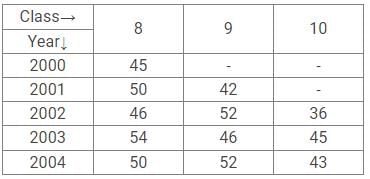
No student in class 10 failed in any of the years and no student failed in the same class more than once.

Q. Approximately what percentage of the students in class 8 in 2002, passed the final exams? 

Detailed Solution for MCQ Test: Missing Data Interpretation - 1 - Question 18

Following the common explanation, we get
Of the 46 students in class 8 in 2002, 39 got promoted to class 9 in 2003, i.e.,

Hence, option B is correct.

Common explanation:

As it is given that a student who passes the final exams gets promoted to the next class, we can see that only 42 of the 45 students in class 8 in the year 2000, reached class 9, which means that 3 students had failed in the class that year. As the number of students in class 8 in 2001 is 50, 47 new students (50-3 failed students) joined class 8 in that year. In 2002, 36 students passed out of class 10, which means of the 42 students in class 9 in 2001, only 36 passed and 6 failed. This six students will remain in class 9 in 2002 also and as these are 52 students in class 9 in that year, 46 students were newly promoted, i.e, of the 50 students in class 8 in 2001.
 Similarly, we can find values for other years.

MCQ Test: Missing Data Interpretation - 1 - Question 19

Directions: Read the following table chart carefully and answer the questions given beside.

The following table shows the number of students in classes 8, 9 and 10 in a school. The school started in 2000 and students are admitted only in class 8. At the end of the year the students who pass the final exams get promoted to the next class while the students who fail stay in the same class and are joined by a new bunch of students, who are either promoted (class 9 and 10) or who joined the school new (class 8). All students who pass the class 10 exams pass out of the school.
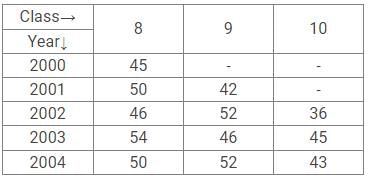
No student in class 10 failed in any of the years and no student failed in the same class more than once.

Q. How many students studying in class 9 in the year 2003, failed in the final exams?

Detailed Solution for MCQ Test: Missing Data Interpretation - 1 - Question 19

Following the common explanation, we get
Of the 46 students in class 9 in 2003, only 43 got promoted to class 10,i.e., 3 students failed.
Hence, option B is correct.
Common explanation:

As it is given that a student who passes the final exams gets promoted to the next class, we can see that only 42 of the 45 students in class 8 in the year 2000, reached class 9, which means that 3 students had failed in the class that year. As the number of students in class 8 in 2001 is 50, 47 new students (50-3 failed students) joined class 8 in that year. In 2002, 36 students passed out of class 10, which means of the 42 students in class 9 in 2001, only 36 passed and 6 failed. This six students will remain in class 9 in 2002 also and as these are 52 students in class 9 in that year, 46 students were newly promoted, i.e, of the 50 students in class 8 in 2001.
 Similarly, we can find values for other years.

MCQ Test: Missing Data Interpretation - 1 - Question 20

Directions: Read the following table chart carefully and answer the questions given beside.

The following table shows the number of students in classes 8, 9 and 10 in a school. The school started in 2000 and students are admitted only in class 8. At the end of the year the students who pass the final exams get promoted to the next class while the students who fail stay in the same class and are joined by a new bunch of students, who are either promoted (class 9 and 10) or who joined the school new (class 8). All students who pass the class 10 exams pass out of the school.
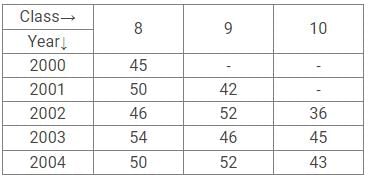
No student in class 10 failed in any of the years and no student failed in the same class more than once.

Q. The total number of students who failed in class 8 from 2000 to 2003 is

Detailed Solution for MCQ Test: Missing Data Interpretation - 1 - Question 20

Following the common explanation, we get

The total number of students who failed in class 8 from 2000 to 2003 = 3 + 4 + 7 + 5 = 19

Hence, option E is correct.
Common explanation:

As it is given that a student who passes the final exams gets promoted to the next class, we can see that only 42 of the 45 students in class 8 in the year 2000, reached class 9, which means that 3 students had failed in the class that year. As the number of students in class 8 in 2001 is 50, 47 new students (50-3 failed students) joined class 8 in that year. In 2002, 36 students passed out of class 10, which means of the 42 students in class 9 in 2001, only 36 passed and 6 failed. This six students will remain in class 9 in 2002 also and as these are 52 students in class 9 in that year, 46 students were newly promoted, i.e, of the 50 students in class 8 in 2001.
 Similarly, we can find values for other years.

17 videos|9 docs|42 tests
Information about MCQ Test: Missing Data Interpretation - 1 Page
In this test you can find the Exam questions for MCQ Test: Missing Data Interpretation - 1 solved & explained in the simplest way possible. Besides giving Questions and answers for MCQ Test: Missing Data Interpretation - 1, EduRev gives you an ample number of Online tests for practice

Top Courses for Bank Exams

Download as PDF

Top Courses for Bank Exams