MCQ Test: Tabular Graph - 2 - Banking Exams MCQ
20 Questions MCQ Test - MCQ Test: Tabular Graph - 2

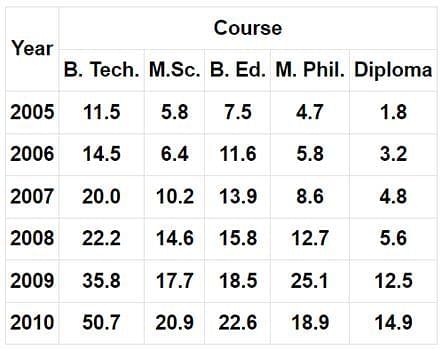
Directions: Study the following table carefully and answer the questions that follow:
Semester fees (In Rs. thousands) for five Different Courses in 6 different years.

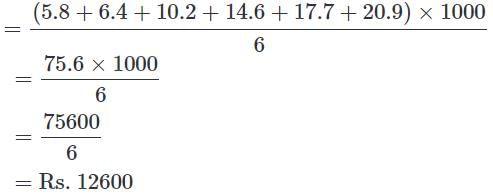
Q. What was the average semester fee charged for M. Sc. course over all the years together?
Semester fees (In Rs. thousands) for five Different Courses in 6 different years.
Directions: Study the following table carefully and answer the questions that follow:
Semester fees (In Rs. thousands) for five Different Courses in 6 different years.
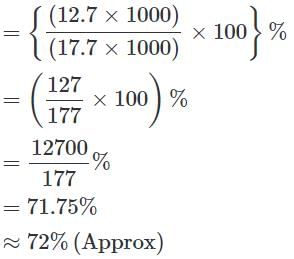
Q. The semester fee charged for M. Phil course in the year 2008 was approximately what percentage of the semester fee charged for M. Sc course in the year 2009?
Semester fees (In Rs. thousands) for five Different Courses in 6 different years.

Directions: Study the following table carefully and answer the questions that follow:
Semester fees (In Rs. thousands) for five Different Courses in 6 different years.

Q. What was the total semester fee charged for all the course together in the year 2006?
Semester fees (In Rs. thousands) for five Different Courses in 6 different years.
Directions: Study the following table carefully and answer the questions that follow:
Semester fees (In Rs. thousands) for five Different Courses in 6 different years.

Q. What was the difference between the total semester fee charged for diploma course over the years together and the fee charged for B. Tech Course in the year 2009?
Directions: Study the following table carefully and answer the questions that follow:
Semester fees (In Rs. thousands) for five Different Courses in 6 different years.

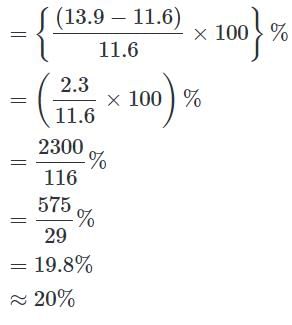
Q. What was the approximate per cent increase in the semester fees of B. Ed. course in the year 2007 as compared to the previous year?
The following table gives the percentage distribution of population of five states, P, Q, R, S and T on the basis of poverty line and also on the basis of sex.
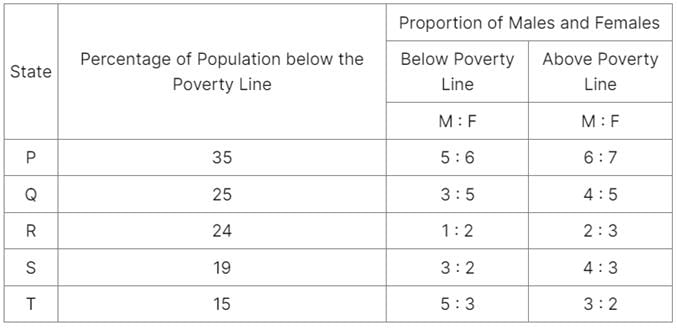
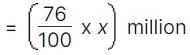
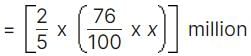
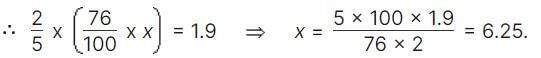
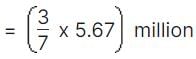
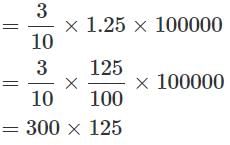
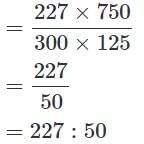
Q. If the male population above poverty line for State R is 1.9 million, then the total population of State R is?
The following table gives the percentage distribution of population of five states, P, Q, R, S and T on the basis of poverty line and also on the basis of sex.

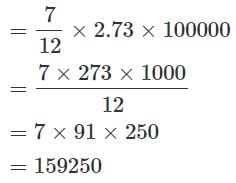
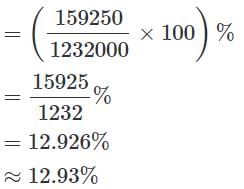
Q. What will be the number of females above the poverty line in the State S if it is known that the population of State S is 7 million?
Study the following table and answer the questions based on it.
Expenditures of a Company (in Lakh Rupees) per Annum Over the given Years.

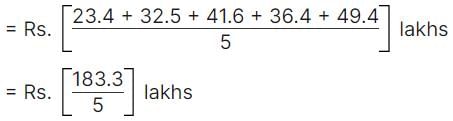
Q. What is the average amount of interest per year which the company had to pay during this period?
Study the following table and answer the questions based on it.
Expenditures of a Company (in Lakh Rupees) per Annum Over the given Years.

Q. The ratio between the total expenditure on Taxes for all the years and the total expenditure on Fuel and Transport for all the years respectively is approximately?
Study the following table and answer the questions based on it.
Expenditures of a Company (in Lakh Rupees) per Annum Over the given Years.

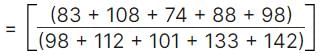
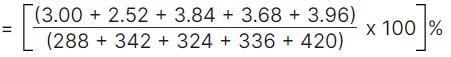
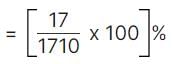
Q. The total amount of bonus paid by the company during the given period is approximately what percent of the total amount of salary paid during this period?
Study the following table and answer the questions based on it.
Expenditures of a Company (in Lakh Rupees) per Annum Over the given Years.
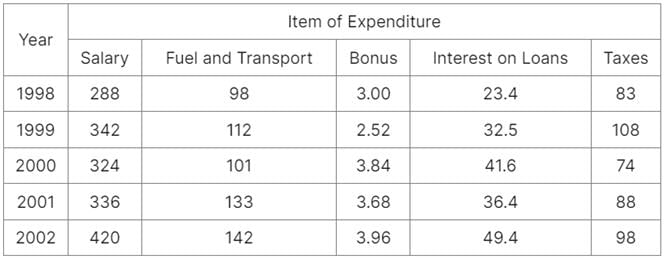
Q. The total expenditure of the company over these items during the year 2000 is?
Study the following table and answer the questions based on it.
Expenditures of a Company (in Lakh Rupees) per Annum Over the given Years.

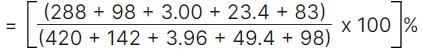
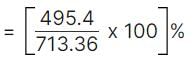
Q. Total expenditure on all these items in 1998 was approximately what percent of the total expenditure in 2002?
Directions: Study the following table carefully and answer the question that follow:
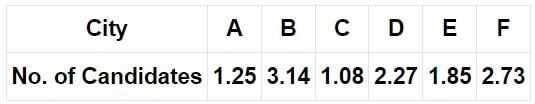
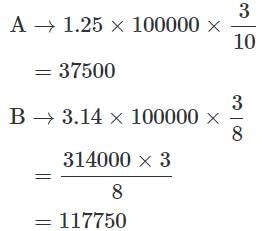
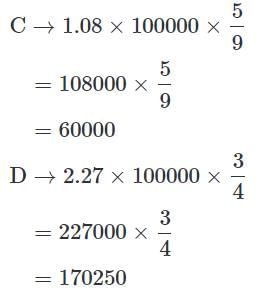
Number of candidates (in lakhs) appearing in a Entrance Examination from six different Cities.

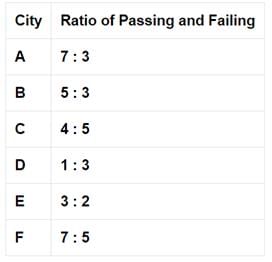
Ratio of Candidates Passing and Failing Within the City

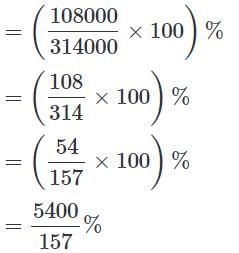
Q. The number of candidates appearing for the exam from City C is what per cent of the number of candidates appearing for the exam from City B? (rounded to nearest integer)
Directions: Study the following table carefully and answer the question that follow:
Number of candidates (in lakhs) appearing in a Entrance Examination from six different Cities.
Ratio of Candidates Passing and Failing Within the City

Q. Which city has the highest number of students failing the entrance exam?
Directions: Study the following table carefully and answer the question that follow:
Number of candidates (in lakhs) appearing in a Entrance Examination from six different Cities.

Ratio of Candidates Passing and Failing Within the City
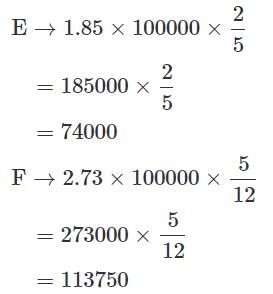
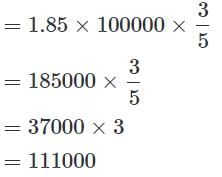
Q. What is the number of candidates passing the exam from city E?
Directions: Study the following table carefully and answer the question that follow:
Number of candidates (in lakhs) appearing in a Entrance Examination from six different Cities.

Ratio of Candidates Passing and Failing Within the City

Q. What is the ratio of the number of candidates failing the exam from City D to that of those failing the exam from City A?
Directions: Study the following table carefully and answer the question that follow:
Number of candidates (in lakhs) appearing in a Entrance Examination from six different Cities.
Ratio of Candidates Passing and Failing Within the City
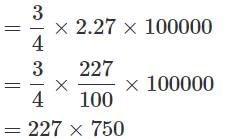
Q. The number of candidates passing the examination from City F is what per cent of the total number of candidates appearing from all the cities together? ( rounded off to two digits after the decimal)
The following table gives the percentage of marks obtained by seven students in six different subjects in an examination.
The Numbers in the Brackets give the Maximum Marks in Each Subject.

Q. What are the average marks obtained by all the seven students in Physics? (rounded off to two digit after decimal)
The following table gives the percentage of marks obtained by seven students in six different subjects in an examination.
The Numbers in the Brackets give the Maximum Marks in Each Subject.
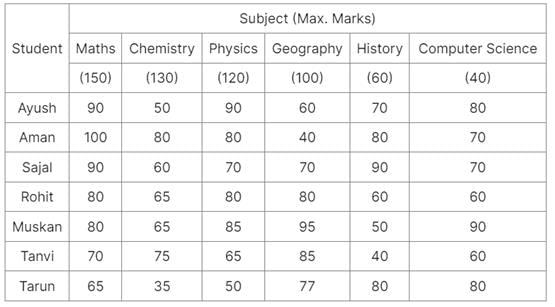
Q. What is the overall percentage of Tarun?
The following table gives the percentage of marks obtained by seven students in six different subjects in an examination.
The Numbers in the Brackets give the Maximum Marks in Each Subject.

Q. The number of students who obtained 60% and above marks in all subjects is?


Important Questions for MCQ Test: Tabular Graph - 2
MCQ Test: Tabular Graph - 2
Online Tests for MCQ Test: Tabular Graph - 2
|
© EduRev
|
Education Revolution
|


|


