Practice Test: Pie Chart - 3 - CAT MCQ
10 Questions MCQ Test - Practice Test: Pie Chart - 3

Direction: Refer to the following information on prices and production of crude oil for the period 1973-80 and answer the questions given below. In the first graph, the lines show the prices of crude oil per barrel for domestic production and imports while the bars show the domestic price as a percentage of the import price. In the second graph, the bars show average production of barrels per day in the US and Non-OPEC countries, while the line shows the consumption of oil in the US.
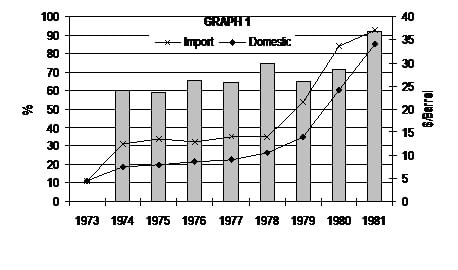
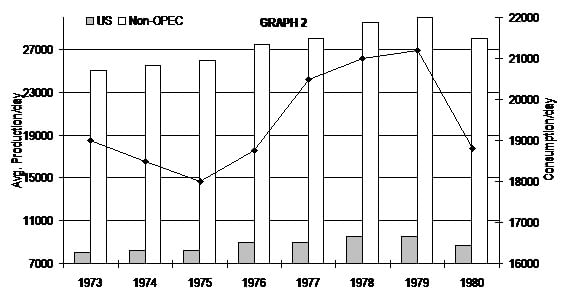
Q. In 1979, if the US imported crude oil in order to meet demands, what is the total cost of imported crude oil?
Direction: Refer to the following information on prices and production of crude oil for the period 1973-80 and answer the questions given below. In the first graph, the lines show the prices of crude oil per barrel for domestic production and imports while the bars show the domestic price as a percentage of the import price. In the second graph, the bars show average production of barrels per day in the US and Non-OPEC countries, while the line shows the consumption of oil in the US.
Q. What is the difference between the total cost of domestic production of crude oil in the US in 1975 and the total cost of crude oil imported by the US in order to meet demands in this year?

Direction: Refer to the following information on prices and production of crude oil for the period 1973-80 and answer the questions given below. In the first graph, the lines show the prices of crude oil per barrel for domestic production and imports while the bars show the domestic price as a percentage of the import price. In the second graph, the bars show average production of barrels per day in the US and Non-OPEC countries, while the line shows the consumption of oil in the US.
Q. Which of the following statements is/are true?
1) The percentage change in the price of imported crude oil in 1974 is approximately 120%.
2) In 1977, the absolute difference between the percentage change in the price of domestic oil and the percentage change in the price of imported oil is approximately 2.
3) The percentage change in the consumption of oil by the US from 1973 to 1979 is -80%.
4) In 1977, the ratio of production of oil by non-OPEC countries to that by the US is 4.25.
Direction: Refer to the following information on prices and production of crude oil for the period 1973-80 and answer the questions given below. In the first graph, the lines show the prices of crude oil per barrel for domestic production and imports while the bars show the domestic price as a percentage of the import price. In the second graph, the bars show average production of barrels per day in the US and Non-OPEC countries, while the line shows the consumption of oil in the US.
Q. What is the difference between the percentage change in the price of imported oil and the price of domestic oil in 1976?
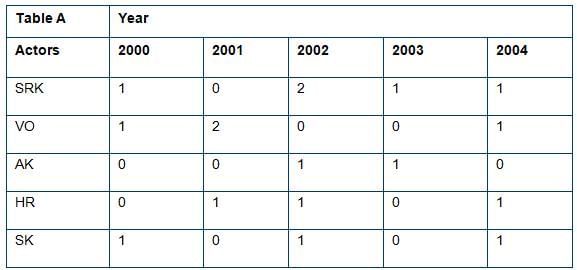
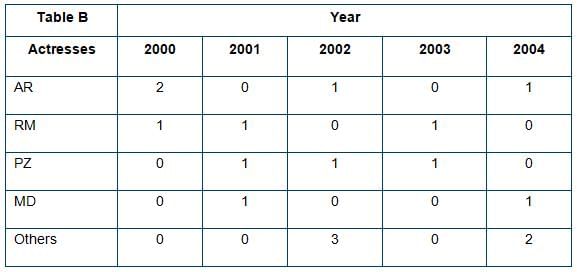
Direction: Table A shows the number of hits scored by leading male actors of the Bollywood film industry in the past 5 years. Table B gives data on who were leading ladies in each of these hit films. The data for the four established actresses is given separately, while the hits of all the other heroines are clubbed under the head “Others”.


Note:
- AR and SK have vowed never to work together in a film. Also PZ has not yet worked with VO.
- Among the four established actresses, AK only works with RM.
- All of SRK’s hits in the past 5 years have been with only two actresses.
- VO only works with established actresses.
Q. In 2002, SRK’s two hits have been with
Direction: Table A shows the number of hits scored by leading male actors of the Bollywood film industry in the past 5 years. Table B gives data on who were leading ladies in each of these hit films. The data for the four established actresses is given separately, while the hits of all the other heroines are clubbed under the head “Others”.

Note:
- AR and SK have vowed never to work together in a film. Also PZ has not yet worked with VO.
- Among the four established actresses, AK only works with RM.
- All of SRK’s hits in the past 5 years have been with only two actresses.
- VO only works with established actresses.
Q. Which actor/actors had the highest number of hits with “other” actresses?
Direction: Table A shows the number of hits scored by leading male actors of the Bollywood film industry in the past 5 years. Table B gives data on who were leading ladies in each of these hit films. The data for the four established actresses is given separately, while the hits of all the other heroines are clubbed under the head “Others”.


Note:
- AR and SK have vowed never to work together in a film. Also PZ has not yet worked with VO.
- Among the four established actresses, AK only works with RM.
- All of SRK’s hits in the past 5 years have been with only two actresses.
- VO only works with established actresses.
Q. MD’s two hits in the past 5 years have been with
Direction: Table A shows the number of hits scored by leading male actors of the Bollywood film industry in the past 5 years. Table B gives data on who were leading ladies in each of these hit films. The data for the four established actresses is given separately, while the hits of all the other heroines are clubbed under the head “Others”.

Note:
- AR and SK have vowed never to work together in a film. Also PZ has not yet worked with VO.
- Among the four established actresses, AK only works with RM.
- All of SRK’s hits in the past 5 years have been with only two actresses.
- VO only works with established actresses.
Q. HR’s hits have been with
Direction: Refer to the following information and answer the questions given below.
The table below shows the financial performance of business houses for a particular year. Study the table and answer the questions based on the information contained in the table.
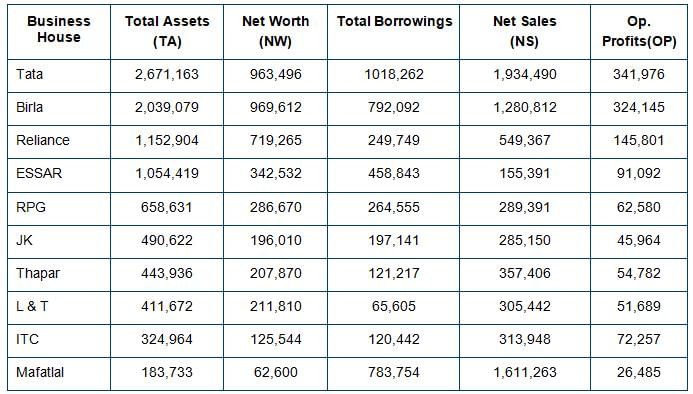
Q. If executive compensation is a function of operating profit on sales, which organisation would be the most remunerative for an executive?
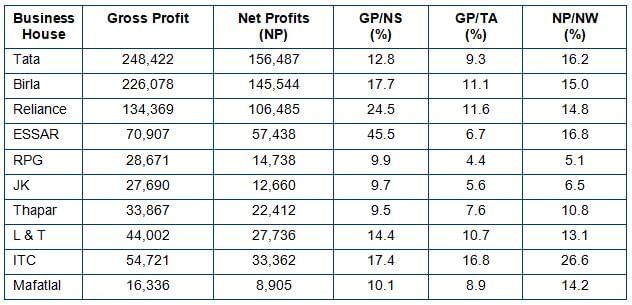
Direction: Refer to the following information and answer the questions given below.
The table below shows the financial performance of business houses for a particular year. Study the table and answer the questions based on the information contained in the table.


Q. If dividends are a function of net profit over net worth, which company should a person invest in?


Important Questions for Practice Test: Pie Chart - 3
Practice Test: Pie Chart - 3 MCQs with Answers
Online Tests for Practice Test: Pie Chart - 3
|
© EduRev
|
Education Revolution
|


|


