Class 10 Exam  >  Class 10 Tests  >  Mathematics (Maths) Class 10  >  RS Aggarwal Test: Statistics - Class 10 MCQ

RS Aggarwal Test: Statistics - Class 10 MCQ


Test Description

25 Questions MCQ Test Mathematics (Maths) Class 10 - RS Aggarwal Test: Statistics

RS Aggarwal Test: Statistics for Class 10 2024 is part of Mathematics (Maths) Class 10 preparation. The RS Aggarwal Test: Statistics questions and answers have been prepared according to the Class 10 exam syllabus.The RS Aggarwal Test: Statistics MCQs are made for Class 10 2024 Exam. Find important definitions, questions, notes, meanings, examples, exercises, MCQs and online tests for RS Aggarwal Test: Statistics below.
Solutions of RS Aggarwal Test: Statistics questions in English are available as part of our Mathematics (Maths) Class 10 for Class 10 & RS Aggarwal Test: Statistics solutions in Hindi for Mathematics (Maths) Class 10 course. Download more important topics, notes, lectures and mock test series for Class 10 Exam by signing up for free. Attempt RS Aggarwal Test: Statistics | 25 questions in 25 minutes | Mock test for Class 10 preparation | Free important questions MCQ to study Mathematics (Maths) Class 10 for Class 10 Exam | Download free PDF with solutions
RS Aggarwal Test: Statistics - Question 1

Which of the following is a measure of central tendency?

Detailed Solution for RS Aggarwal Test: Statistics - Question 1

In statistics, a central tendency is a central or typical value for a probability distribution. It may also be called a center or location of the distribution. Colloquially, measures of central tendency are often called averages. So we have 3 measures of central tendencies namely, mean , median and mode. So mean is the answer as the other three options are the components of the given distribution.

RS Aggarwal Test: Statistics - Question 2

Class mark of a class is obtained by using –

Detailed Solution for RS Aggarwal Test: Statistics - Question 2

Class mark is the mean of the upper limit and lower limit of the class. The class mark is a specific point in the center of the interval in a frequency distribution table. It is defined as the average of the upper and lower class limits. So formula is Class mark =

1 Crore+ students have signed up on EduRev. Have you? Download the App
RS Aggarwal Test: Statistics - Question 3

The value of 

Detailed Solution for RS Aggarwal Test: Statistics - Question 3

We have Mean = 

RS Aggarwal Test: Statistics - Question 4

The mean of the following data 12, 22, 32,.......n2 is –

RS Aggarwal Test: Statistics - Question 5

The mean of following distribution is –

Detailed Solution for RS Aggarwal Test: Statistics - Question 5

mean = ∑fixi
              ∑fi
mean = 10x2+12x3+15x7+25x8
                      2+3+7+8
mean = 20+36+105+200
                       20
mean = 361/20 =18.05

RS Aggarwal Test: Statistics - Question 6

The mean of the following data is 18.75 then the value of p is –

RS Aggarwal Test: Statistics - Question 7

To find mean, we use the formula.

RS Aggarwal Test: Statistics - Question 8

Which of the following can not be determined graphically –

Detailed Solution for RS Aggarwal Test: Statistics - Question 8

Mode is the value with the maximum frequency. Thus, it can be determined from the graph.
Median is the middle value of the data. Thus, it can be determined from the graph.
Mean is the ratio of sum of all data values and the total number of values. Thus, it cannot be determined graphically.
The bell curve or standard deviation graph is used to visualise the spread of data. The standard deviation tells how much the data is clustered around the mean of the data. Lower standard deviation tells that the data is less spread and higher standard deviation tells that data is more spread.

RS Aggarwal Test: Statistics - Question 9

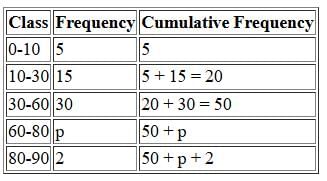
If the median of the following data is 40 then the value of p is –

Detailed Solution for RS Aggarwal Test: Statistics - Question 9

Given that the median of the data is 40, we can determine the value of p as follows:

Step 1: Identify the Cumulative Frequency

Step 2: Determine the Median Class

The median is given as 40, which lies in the class interval 30-60. Thus, the median class is 30-60.

Step 3: Apply the Median Formula

The formula for the median of grouped data is:

Median = L + ( (N/2 - F) / f ) * h

  • L = Lower limit of the median class = 30
  • N = Total frequency = 5 + 15 + 30 + p + 2 = 52 + p
  • F = Cumulative frequency of the class before the median class = 20
  • f = Frequency of the median class = 30
  • h = Class width = 30 (for class 30-60)

Step 4: Substitute Values into the Formula

Given that the median is 40:

40 = 30 + ( (52 + p) / 2 - 20) / 30 ) * 30

Step 5: Simplify the Equation

  1. Calculate (52 + p) / 2:

    (52 + p) / 2 = 26 + p / 2

  2. Substitute into the equation:

    40 = 30 + ( (26 + p / 2 - 20) / 30 ) * 30

  3. Simplify inside the parentheses:

    40 = 30 + (6 + p / 2)

  4. Subtract 30 from both sides:

    10 = 6 + p / 2

  5. Subtract 6 from both sides:

    4 = p / 2

  6. Multiply both sides by 2:

    p = 8

Conclusion

The value of p is: 8

RS Aggarwal Test: Statistics - Question 10

Which of the following is true?

RS Aggarwal Test: Statistics - Question 11

Mode is –

RS Aggarwal Test: Statistics - Question 12

Which of the following is true –

Detailed Solution for RS Aggarwal Test: Statistics - Question 12

Mean = Mode + 3/2 [Median – Mode]
Mean= Mode+3/2 Median-3/2Mode
2 Mean=2 Mode+3 Median-3 Mode
3 Median=2 Mean + Mode
So C is the correct answer.

RS Aggarwal Test: Statistics - Question 13

In the formula for mode of a grouped data, mode = where symbols have their usual meaning f0 represents :

Detailed Solution for RS Aggarwal Test: Statistics - Question 13

f1 is the frequency of the modal class.So , fis the frequency of the class preceding the modal class. So C option is correct.

RS Aggarwal Test: Statistics - Question 14

Median of a given frequency distribution is found with the help of a –

RS Aggarwal Test: Statistics - Question 15

The measure of central tendency which is given by the x-coordinate of the point of intersection of the 'more than' ogive and 'less than' ogive is –

RS Aggarwal Test: Statistics - Question 16

The mean of the first 10 natural numbers is

Detailed Solution for RS Aggarwal Test: Statistics - Question 16

The first 10 natural numbers are 1, 2, 3, 4, 5, 6, 7, 8, 9 and 10.

Mean = Sum of Observations/Total No of Observations

Mean = 1 + 2 + 3 + 4 + 5 + 6 + 7 + 8 + 9 + 10 ÷ 10

Mean = 55/10

Mean = 5.5

RS Aggarwal Test: Statistics - Question 17

The mean of the first 10 prime numbers is

Detailed Solution for RS Aggarwal Test: Statistics - Question 17

Step-by-step explanation:mean=2+3+5+7+11+13+17+19+23+29/10

Mean=129/10

Mean=12.9

RS Aggarwal Test: Statistics - Question 18

The mean of first 10 composite numbers is

RS Aggarwal Test: Statistics - Question 19

The marks obtained by 9 students in Mathematics are 59, 46, 31, 23, 27, 40, 52, 35 and 29. The mean of the data is

Detailed Solution for RS Aggarwal Test: Statistics - Question 19

The mean is the average of the numbers.
So, Mean = 
Mean= =342/9=38

RS Aggarwal Test: Statistics - Question 20

The mean of the first 10 natural odd numbers is

Detailed Solution for RS Aggarwal Test: Statistics - Question 20

Natural numbers start from 1
First ten natural odd numbers=1,3,5,7,9,11,13,15,17,19
Mean = 
So mean is 10.

RS Aggarwal Test: Statistics - Question 21

The mean of the first 10 multiples of 6 is

Detailed Solution for RS Aggarwal Test: Statistics - Question 21

We have first ten multiples of 6 as follows:
6,12,18,24,30,36,42,48,54,60

RS Aggarwal Test: Statistics - Question 22

The mean of all the factors of 24 is

Detailed Solution for RS Aggarwal Test: Statistics - Question 22

To find the mean of all the factors of 24:

- List the factors of 24: 1, 2, 3, 4, 6, 8, 12, 24.
- Sum the factors: (1 + 2 + 3 + 4 + 6 + 8 + 12 + 24 = 60).
- Count the factors: There are 8 factors.
- Calculate the mean: Sum of the factors/ number of the factors = 60/8 = 7.5
Thus, the mean of all the factors is 7.5. The correct answer is A: 7.5.

RS Aggarwal Test: Statistics - Question 23

The marks obtained by 9 students in Mathematics are 59, 46, 31, 23, 27, 44, 52, 40 and 29. The mean of the data is

Detailed Solution for RS Aggarwal Test: Statistics - Question 23

The mean is the average of the numbers.
So, Mean = 
Mean= 351/9=39

RS Aggarwal Test: Statistics - Question 24

The arithmetic mean of a set of 40 values is 65. If each of the 40 values is increased by 5, what will be the mean of the set of new values:

Detailed Solution for RS Aggarwal Test: Statistics - Question 24

We have mean = 
Mean = 
Now each value is increased by 5
Mean = 
+5=65+5=70
Hence the mean is 70

RS Aggarwal Test: Statistics - Question 25

The mean of 25 observations is 36. If the mean of first 13 observations is 32 and that of the last 13 observations is 39, then the 13th observation is

Detailed Solution for RS Aggarwal Test: Statistics - Question 25
Mean of 25 observation = 36
Sum of 25 observations = 36 x 25 = 900

Mean of first 13 observations = 32
Sum of first 13 observations = 32 x 13 = 416

Mean of last 13 observations = 39
Sum of last 13 observations= 39 x 13 = 507

13th observation = (416 + 507) - 900
13th observation= 923 - 900
So, 13th observation = 23
123 videos|457 docs|77 tests
Information about RS Aggarwal Test: Statistics Page
In this test you can find the Exam questions for RS Aggarwal Test: Statistics solved & explained in the simplest way possible. Besides giving Questions and answers for RS Aggarwal Test: Statistics, EduRev gives you an ample number of Online tests for practice

Top Courses for Class 10

123 videos|457 docs|77 tests
Download as PDF

Top Courses for Class 10