SSC CGL Previous Year Questions: Venn Diagram - 1 - SSC CGL MCQ
20 Questions MCQ Test SSC CGL Previous Year Papers - SSC CGL Previous Year Questions: Venn Diagram - 1
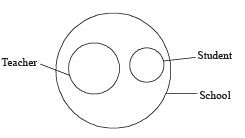
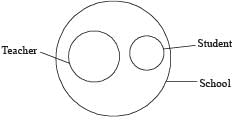
Select the Venn diagram that best represents the relationship among the given set of classes. (SSC CGL 2018)
Students, Teachers, School
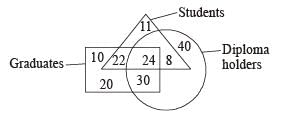
In the Venn diagram shown here, the triangle represent ‘students’, the circle represents ‘diploma holders’ and the quadrilateral represents ‘graduates’. The numbers given in the diagram represents number of persons of that particular category.
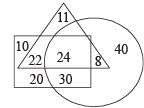
How many students are diploma holders but NOT graduates? (SSC CGL 2018)

How many students are diploma holders but NOT graduates? (SSC CGL 2018)
Select the Venn diagram that best illustrates the relationship between the following classes. (SSC CHSL 2018)
Wools, Wood, Leather
In the following diagram, the triangle represents ‘actors’, the circle represents ‘instrumentalists’ and the rectangle represents ‘dancers’. The numbers in different segments show the number of persons. (SSC Sub. Ins. 2018)
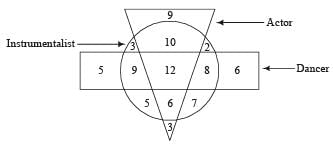
How many dancers are instrumentalists but not actors?
In the following diagram, the triangle represents ‘rich’, the circle represents ‘Farmer’ and the rectangle represents ‘rural’.The numbers in different segments show the number of persons. (SSC Sub. Ins. 2018)
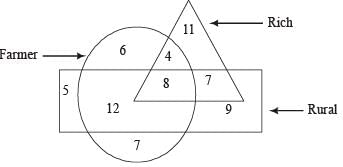
How many rich Farmers are not rural?
In the following diagram, the triangle represents ‘actors’, the circle represents ‘male’, the rectangle represents ‘painters’ and the square represents ‘artists’. The numbers in different segments show the number of persons. (SSC Sub. Ins. 2018)
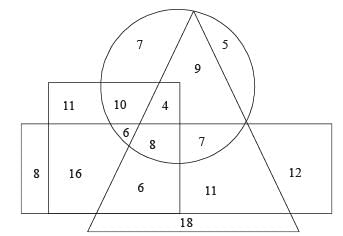
How many male actors are painters but not artists?
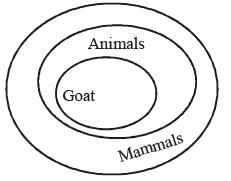
Which Venn diagram best represents the given set of classes? (SSC Stenographer 2018)
Animals, Mammals, Goat
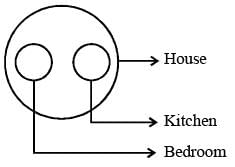
Which Venn diagr am best r epresen ts th e given set of classes? (SSC Stenographer 2018)
Bedroom, Kitchen, House
In the given figure, how many pens are blue? (SSC CGL 2017)
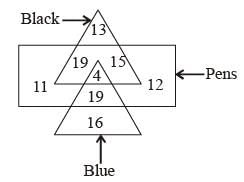
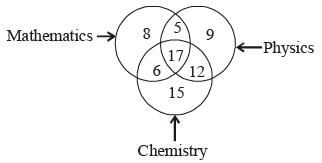
In the given figure, how many people study only 2 subjects? (SSC CGL 2017)
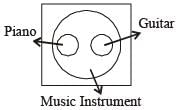
Identify the diagram that best represents the relationship among the given classes. (SSC CGL 2017)
Music Instrument, Piano, Guiter
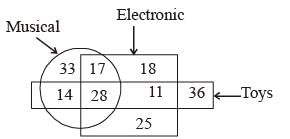
In the given figure, how many are musical toys? (SSC CGL 2017)
Identify the diagram that best represents the relationship among the given classes. (SSC CHSL 2017)
Earth, Saturn, Planet, Star
Choose the correct Venn diagram which best illustrates the relationship among . (SSC MTS 2017)
Hockey, Cricket, Games
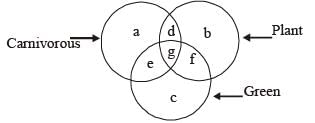
In the given figure, which letter represents carnivorous plants which a re not green? (SSC Sub.ins. 2017)
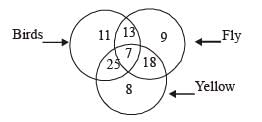
In the given figure, how many yellow birds ar e there? (SSC Sub.ins. 2017)
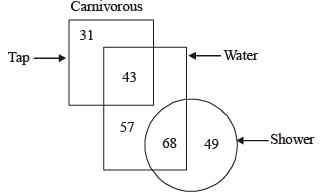
In the given figure, How many water are either tap or shower? (SSC Sub.ins. 2017)
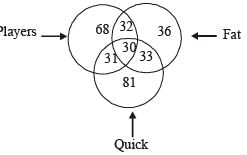
In the given figure, how many players are quick and fat? (SSC Sten. 2017)
Select the Venn diagram that best represents the relationship among the given set of classes. (SSC CGL 2017) Students, Teachers, School
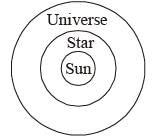
Identify the diagram that best represents the relationship among classes given below: (SSC CGL 1st Sit. 2016)
Universe,Stars,Sun
|
319 docs|337 tests
|


