Test: Bar Graph - Bank Exams MCQ
10 Questions MCQ Test - Test: Bar Graph
Study the following bar chart carefully and answer the given question.
Data regarding the number of people who were tested positive with COVID-19 during January, February and March in five countries is given in the stack bar chart.
Data of number of People in five countries who were found positive with COVID-19 test
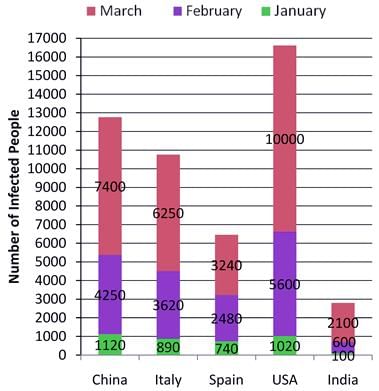
Q. Which countries in February showed more than 3000 positive tests?

Study the following bar chart carefully and answer the given question.
Data regarding the number of people who were tested positive with COVID-19 during January, February and March in five countries is given in the stack bar chart.
Data of number of People in five countries who were found positive with COVID-19 test
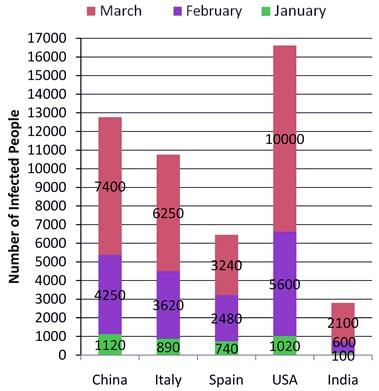
Q. Japan in January had twice the number of cases that India had in January while 50% more cases in February than India that India had in February. Find the number of cases in Japan in March if cases in March were twice the total cases till February end.

Study the following bar chart carefully and answer the given question.
Data regarding the number of people who were tested positive with COVID-19 during January, February and March in five countries is given in the stack bar chart.
Data of number of People in five countries who were found positive with COVID-19 test
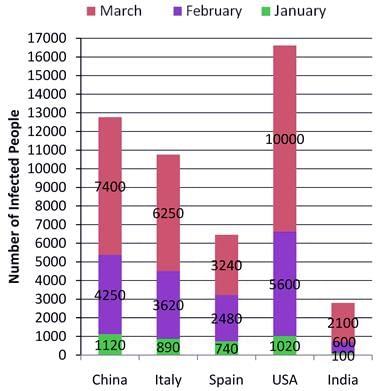
Q. Find the average number of people per day who were tested positive in India in March.

Directions: Read the following information carefully and answer the questions based on it.
Following bar graph shows number of students of different branches of a college. Study the graph and answer the following question.
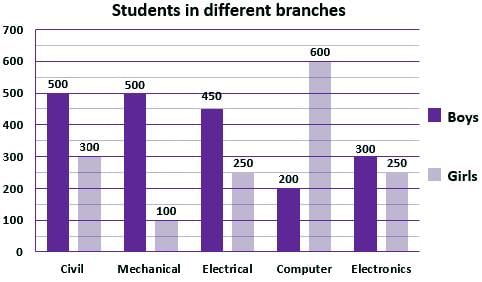
Q. Which branch has minimum ratio of boys’ and girls’ students?
Directions: Read the following information carefully and answer the questions based on it.
Following bar graph shows number of students of different branches of a college. Study the graph and answer the following question.
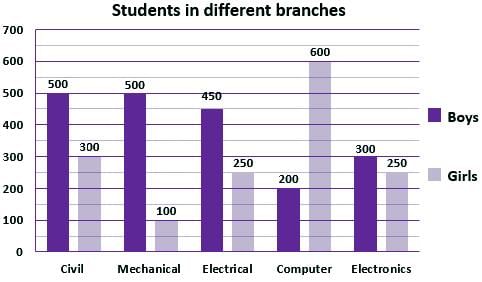
Q. Ratio of total number of students in computer branch to total number of Students of Mechanical and Electronics is -
Directions: Read the following information carefully and answer the questions based on it.
Following bar graph shows number of students of different branches of a college. Study the graph and answer the following question.
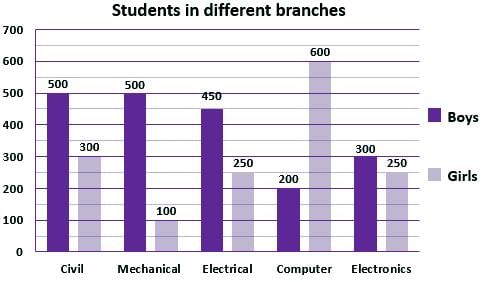
Q. Find the average number of boys in a college including five branches.
Directions : Study the following bar chart carefully and answer the given questions.
The following graph gives the information of milk production (in billion litres) in 6 different countries of the world.
(Assume that there are only six countries in the world which produce milk)
1 billion = 100 crore = 10000 lakhs
Global Milk Production (2017)
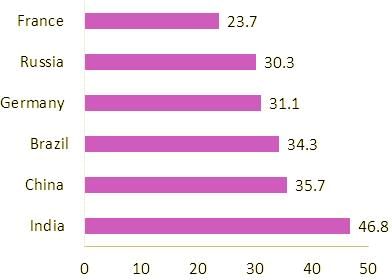
Q. What percentage of the total milk production in the world in 2017 is contributed by India’s total milk production in that year?
Directions : Study the following bar chart carefully and answer the given questions.
The following graph gives the information of milk production (in billion litres) in 6 different countries of the world.
(Assume that there are only six countries in the world which produce milk)
1 billion = 100 crore = 10000 lakhs
Global Milk Production (2017)
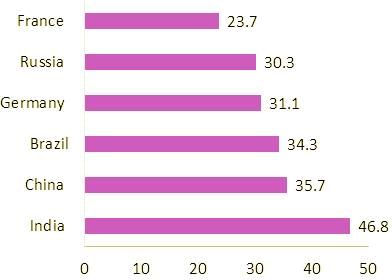
Q. Find the maximum difference between the quantity of milk produced by any two countries?
The given histogram shows the daily wages ( in Rs.) of workers in a factory.
study the histogram and answer the question that follows.
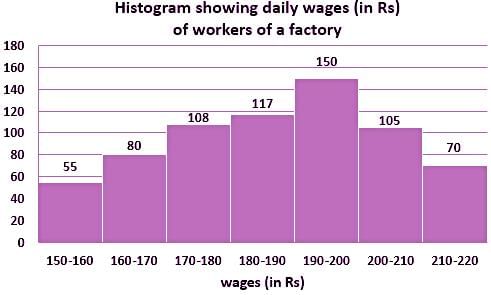
Q. The number of workers with daily wages less than Rs. 180 is what percentage of the number of workers with daily wages more than Rs. 190? Express your answer correct to one decimal place.
Direction : Study the following bar chart carefully and answer the given question.The bar graphs given below show the gender-wise deaths (in thousands) in five countries for the year 2016 and 2017.
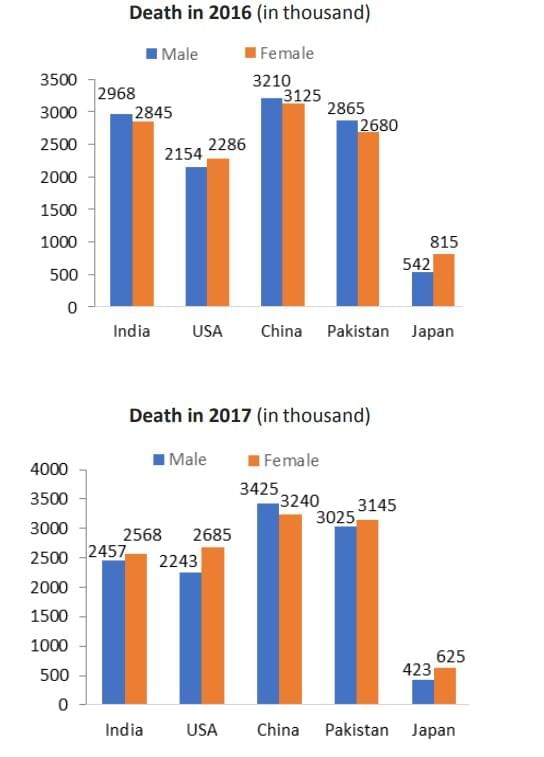
Q. In how many countries was the number of deaths in 2016 less than that in 2017?


