Class 3 Exam  >  Class 3 Tests  >  Mathematics for Class 3: NCERT  >  Test: Bargraph & Tally Marks - Class 3 MCQ

Test: Bargraph & Tally Marks - Class 3 MCQ


Test Description

15 Questions MCQ Test Mathematics for Class 3: NCERT - Test: Bargraph & Tally Marks

Test: Bargraph & Tally Marks for Class 3 2024 is part of Mathematics for Class 3: NCERT preparation. The Test: Bargraph & Tally Marks questions and answers have been prepared according to the Class 3 exam syllabus.The Test: Bargraph & Tally Marks MCQs are made for Class 3 2024 Exam. Find important definitions, questions, notes, meanings, examples, exercises, MCQs and online tests for Test: Bargraph & Tally Marks below.
Solutions of Test: Bargraph & Tally Marks questions in English are available as part of our Mathematics for Class 3: NCERT for Class 3 & Test: Bargraph & Tally Marks solutions in Hindi for Mathematics for Class 3: NCERT course. Download more important topics, notes, lectures and mock test series for Class 3 Exam by signing up for free. Attempt Test: Bargraph & Tally Marks | 15 questions in 20 minutes | Mock test for Class 3 preparation | Free important questions MCQ to study Mathematics for Class 3: NCERT for Class 3 Exam | Download free PDF with solutions
Test: Bargraph & Tally Marks - Question 1

Which color do students like the most?

Test: Bargraph & Tally Marks - Question 2

How many students ride their bicycle to school?

1 Crore+ students have signed up on EduRev. Have you? Download the App
Test: Bargraph & Tally Marks - Question 3

what fruit do students like the most?

Test: Bargraph & Tally Marks - Question 4

Which two animals are same in number?

Test: Bargraph & Tally Marks - Question 5

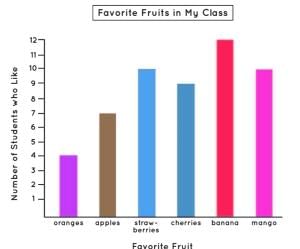
The given graph shows the number of books read by pupils in a class from July to December. Study the given graph and answer the following question.

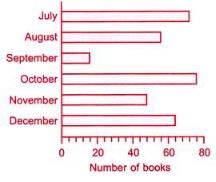
Q. How many books were read altogether from July to November?

Detailed Solution for Test: Bargraph & Tally Marks - Question 5

Number of books read in July = 72
Number of books read in August = 56
Number of books read in September =16
Number of books read in October = 76
Number of books read in November = 48
∴Total number of books read from July to November =72+56+16+76+48=268

Test: Bargraph & Tally Marks - Question 6

DIRECTION: The given bar graph shows the amount of money spent by Amit in a week. Study the graph and answer the questions.

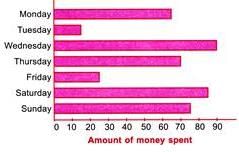
Q. How much more amount Amit spent on Thursday than on Tuesday?

Detailed Solution for Test: Bargraph & Tally Marks - Question 6

Amount spent on Thursday = Rs. 70 Amount spent on Tuesday = Rs. 15 So, more amount spent on Thursday than on Tuesday = Rs. 70 − Rs. 15 = Rs. 55

Test: Bargraph & Tally Marks - Question 7

DIRECTION: The given bar graph shows the amount of money spent by Amit in a week. Study the graph and answer the questions. 

Q. On which day Amit spent Rs. 65?

Detailed Solution for Test: Bargraph & Tally Marks - Question 7

According to the bar graph, on Monday Amit spent Rs. 65.

Test: Bargraph & Tally Marks - Question 8

DIRECTION: The given bar graph shows the amount of money spent by Amit in a week. Study the graph and answer the questions.

Q. Find the amount of money spent by Amit on Sunday.

Detailed Solution for Test: Bargraph & Tally Marks - Question 8

Amount of money spent by Amit on Sunday = Rs. 75.

Test: Bargraph & Tally Marks - Question 9

DIRECTION: The given bar graph shows the amount of money spent by Amit in a week. Study the graph and answer the questions. 

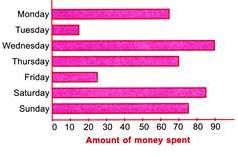
Q. How much less Amount Amit spent on Friday than on Wednesday?

Detailed Solution for Test: Bargraph & Tally Marks - Question 9

Amount spent on Friday = Rs. 25 Amount spent on Wednesday = Rs. 90
∴ Required difference = Rs. 90 − Rs. 25 = Rs. 65. So, Amit spent Rs. 65 less on Friday than on Wednesday.

Test: Bargraph & Tally Marks - Question 10

DIRECTION: The given graph shows the number of people who attended a book fair. Study it carefully and answer the following questions. 

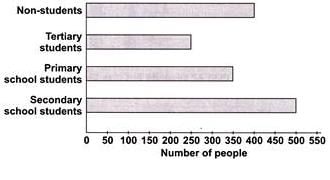
Q. The number of secondary school students was twice the number of________.

Detailed Solution for Test: Bargraph & Tally Marks - Question 10

Number of secondary school students = 500
Number of tertiary students = 250
∴ Number of secondary school students = 2 × number of tertiary students

Test: Bargraph & Tally Marks - Question 11

DIRECTION: The given graph shows the number of people who attended a book fair. Study it carefully and answer the following questions. 

Q. How many less tertiary students attended book fair than primary school students?

Detailed Solution for Test: Bargraph & Tally Marks - Question 11

Number of primary school students = 350 Number of tertiary students = 250
∴ Difference = 350 − 250 =100 So, 100 less tertiary students visited book fair than primary school students.

Test: Bargraph & Tally Marks - Question 12

DIRECTION: The given graph shows the number of people who attended a book fair. Study it carefully and answer the following questions.

Q. Number of secondary school students are ______ more than non-students.

Detailed Solution for Test: Bargraph & Tally Marks - Question 12

Number of secondary school students = 500 Number of non-students = 400
∴ Difference = 500 − 400 =100 So, 100 more secondary school students visited book fair than non-students.

Test: Bargraph & Tally Marks - Question 13

How many tally marks?

Test: Bargraph & Tally Marks - Question 14

What type of graph is this?

Test: Bargraph & Tally Marks - Question 15

How many tally marks?

39 videos|119 docs|58 tests
Information about Test: Bargraph & Tally Marks Page
In this test you can find the Exam questions for Test: Bargraph & Tally Marks solved & explained in the simplest way possible. Besides giving Questions and answers for Test: Bargraph & Tally Marks, EduRev gives you an ample number of Online tests for practice

Top Courses for Class 3

39 videos|119 docs|58 tests
Download as PDF

Top Courses for Class 3