Test: Data Handling - 1 - CTET & State TET MCQ
20 Questions MCQ Test - Test: Data Handling - 1


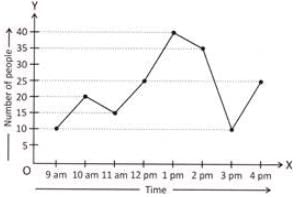
Direction: given line graph represents the number of people in a store since its opening till closing at various times of a day
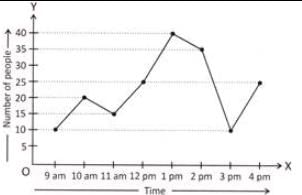
Study the line graph and answer the questions given below:
How many people were there at the store between 1 pm to 2 pm?
Directions: Given line graph represents the number of people in a store since its opening till closing at various times of a day.
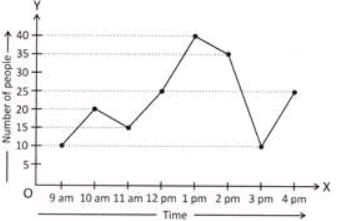
Study the line graph and answer the questions given below:
How many people were there in the store when it closed?
In the following question, if > represents 30 people, then how many people visit Sri Lanka?
- Maldives: >>
- Sri Lanka: >>>
- Bangladesh: >
- Malaysia: >>>>
The pictograph shows the distances of towns W, X and Y from town Z.
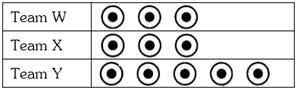
Which of the following is farthest Z ?
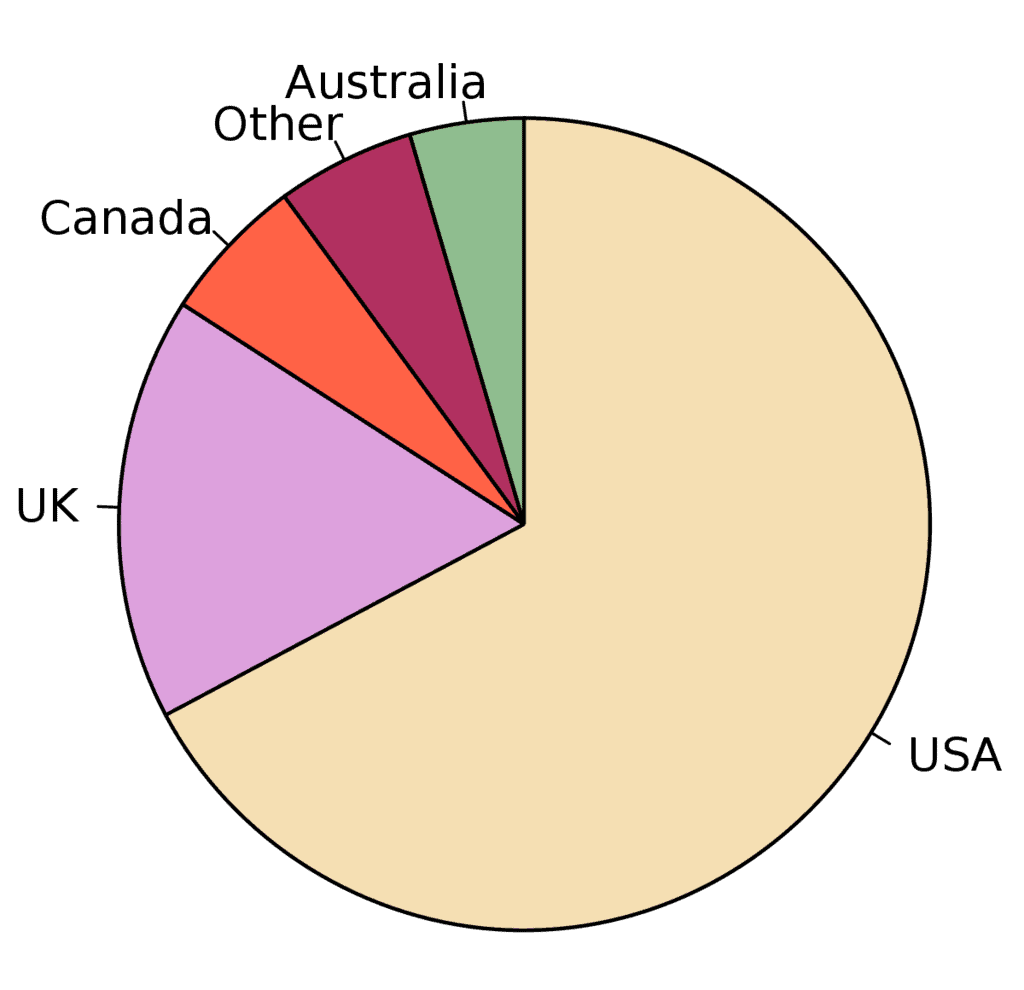
A graph in the shape of a circle to show relative sizes of data is called:
Directions: Given line graph represents the number of people in a store since its opening till closing at various times of a day.
Study the line graph and answer the question given below:
How many people were there in the store when it opened?
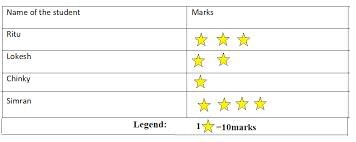
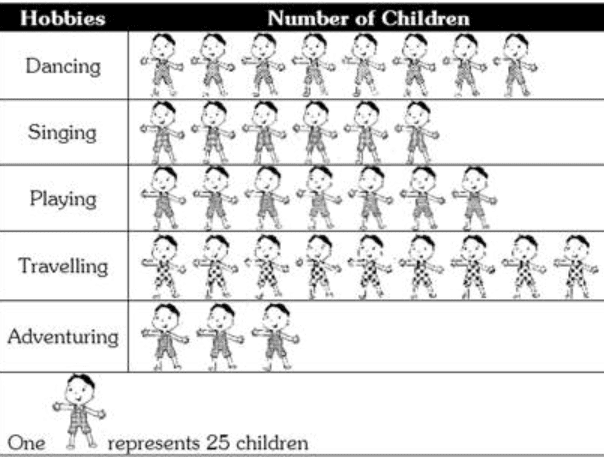
Find the number of children whose hobby is either travelling or adventuring?
Which number continues the given number pattern? 40, 36, 32, 28, 24 _________
Important Questions for Data Handling - 1
Data Handling - 1 MCQs with Answers
Online Tests for Data Handling - 1
|
© EduRev
|
Education Revolution
|


|


