Test: Data Handling - Class 4 MCQ
10 Questions MCQ Test - Test: Data Handling

Why are pictographs considered easier to understand than tables?
The picture graph below shows the number of pencils that 5 boys have.
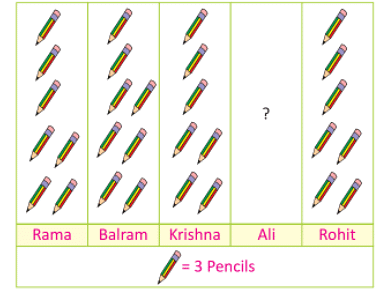
If there are a total 120 pencils, then Ali has _______ pencils.

Directions: The data given in the table below represents the number of tickets won by kids in a games parlour.
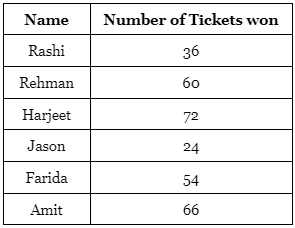
Q. The difference between tickets won by Rehman and Amit can be represented in the form of tally marks as
Directions: The data given in the table below represents the number of tickets won by kids in a games parlour.

Q.  are the tickets won by
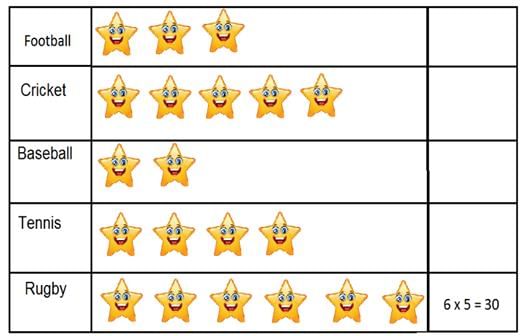
Directions: Study the given pictograph carefully and answer the following question.
The pictograph below gives the numbers of students who like different sports in a school.
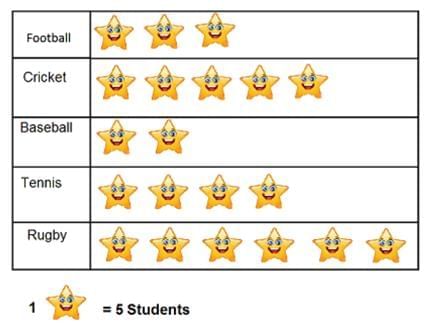
How many students in total like sports?
Directions: Study the given pictograph carefully and answer the following question.
The pictograph below gives the numbers of students who like different sports in a school.

How many students like Rugby?
Directions: Study the given graph and answer the following question.
The graph below shows the numbers of people who like different fruits.

How many people in total like apple and orange?
Directions: Study the given graph and answer the following question.
The graph below shows the numbers of people who like different fruits.
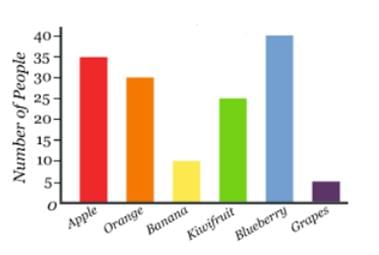
How many more people like blueberry than grapes?
A _________ is a representation of numbers using bars of uniform widths.
Important Questions for Data Handling
Data Handling MCQs with Answers
Online Tests for Data Handling
|
© EduRev
|
Education Revolution
|


|


