Test: Data Interpretation- 4 - Railways MCQ
20 Questions MCQ Test - Test: Data Interpretation- 4

(Q.no: 1-5). Refer to the following Line Graph and answer the given questions.
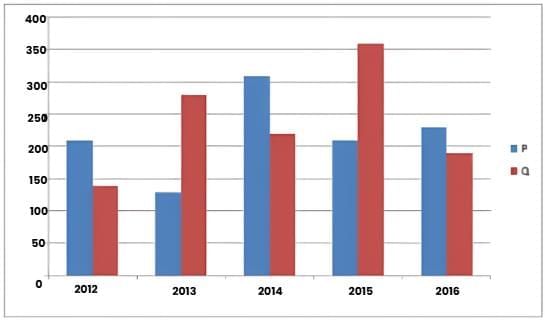
In 2013, out of the total number of applications received for Universities P and Q together, only 30% were accepted. What was the total number of applications accepted for Universities P and Q together in 2013?
(Q.no: 1-5). Refer to the following Line Graph and answer the given questions.
In 2012, 30% of applications received for University P and 20% of applications received for University Q were from international students. What was the total number of International applicants for University P and Q together in 2012?

(Q.no: 1-5). Refer to the following Line Graph and answer the given questions.
If the respective ratio of total number of applications received for University P and Q together in 2016 and 2017 is 3:4. What was the total number of applications received for University P and Q together in 2017?
(Q.no: 1-5). Refer to the following Line Graph and answer the given questions.
What is the average number of applications received for University P in 2013, 2015 and 2016?
(Q.no: 1-5). Refer to the following Line Graph and answer the given questions.
Number of applications received for University Q increased by what percent from 2012 to 2014?
(Q.no: 6-10). Refer to the following Line Graph and answer the given questions.
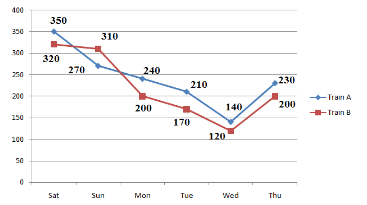
The number of people who traveled by Train B on Friday is 30% more than the people who traveled by the same train on Thursday. What is the respective ratio between the number of people who traveled on Friday and those who traveled on Saturday by the same train?
(Q.no: 6-10). Refer to the following Line Graph and answer the given questions.
What is the difference between the total number of people who traveled by Train B on Saturday and Sunday together and the total number of people who traveled by Train A on Saturday and Sunday together?
(Q.no: 6-10). Refer to the following Line Graph and answer the given questions.
What is the average number of people traveling by Train B on Monday, Tuesday, Wednesday and Thursday?
(Q.no: 6-10). Refer to the following Line Graph and answer the given questions.
The number of people who traveled by Train A decreased by what percent from Saturday to Wednesday?
(Q.no: 6-10). Refer to the following Line Graph and answer the given questions.
The total number of people who traveled by both the given trains together on Monday is approximately what percent more than the total number of people who traveled by both the given trains together on Wednesday?
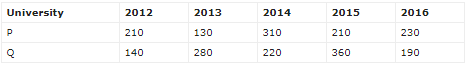
(Q.no: 15-20). Refer to the table and answer the given questions.
Total Population in Five Cities = 15,00,000
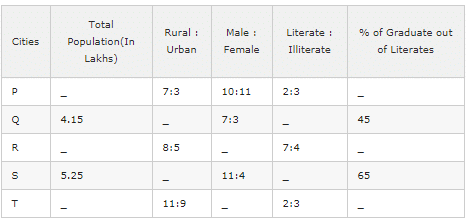
The total population of City P and R is 7,85,000. The difference between the total population of City P and R is 2.65 lakhs. If the City P has more population than City R then the urban population of City P and R together is approximately what percent of total population of these two Cities?
(Q.no: 15-20). Refer to the table and answer the given questions.
Total Population in Five Cities = 15,00,000
The difference between the number of male and female in the City P is 10000. Approximately, by what percent of urban population of City P less than its Rural population?
(Q.no: 15-20). Refer to the table and answer the given questions.
Total Population in Five Cities = 15,00,000
One – fourth of total population of City R is 2,20,000. If the total number of Literate graduates of City Q and S are 22,500 and 52,000. What % of the total population of City Q, R and S together is literate?
(Q.no: 15-20). Refer to the table and answer the given questions.
Total Population in Five Cities = 15,00,000
The difference between the total population of City R and T is 30,000. The ratio of total population of City R and T is 44:41. Total % of Literate graduates of City R and T is 90%. If the % Literate graduates of City T is equalled to two times of Literate graduates of City R then what is the difference between the number of graduates from City R and City T?
(Q.no: 15-20). Refer to the table and answer the given questions.
Total Population in Five Cities = 15,00,000
What is the sum of female population in City Q and male population in City S together ?
(Q.no: 16 -20). Refer to the table and answer the given questions.
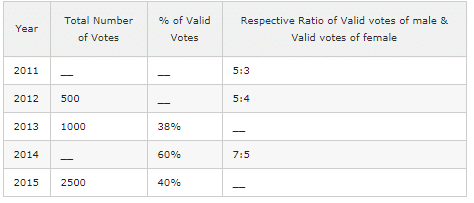
In 2013, if the number of valid votes of female was 100, what was the respective ratio of number of valid votes of male and number of valid votes of female same year?
(Q.no: 16 -20). Refer to the table and answer the given questions.
The total number of votes increased by 50% from 2012 to 2016. If 16% of the votes valid in 2016, what was the number of valid votes in 2016?
(Q.no: 16 -20). Refer to the table and answer the given questions.
If the average number of valid votes in 2012 and 2015 was 635, approximately, what percent of total votes valid in 2012?
(Q.no: 16 -20). Refer to the table and answer the given questions.
In 2014, if the difference between number of valid votes of male and number of valid votes of female was 150, what was the total number of votes in 2014?
(Q.no: 16 -20). Refer to the table and answer the given questions.
In 2011, the respective ratio of total number of votes to valid votes was 5:4. Number of valid votes of female in 2011 constitutes what percent of the total number of votes in the same year?
Important Questions for Data Interpretation- 4
Data Interpretation- 4 MCQs with Answers
Online Tests for Data Interpretation- 4
|
© EduRev
|
Education Revolution
|


|


