Frequency Domain Analysis of Control Systems- 3 - Free MCQ Practice Test
MCQ Practice Test & Solutions: Test: Frequency Domain Analysis of Control Systems- 3 (20 Questions)
You can prepare effectively for Electrical Engineering (EE) Control Systems with this dedicated MCQ Practice Test (available with solutions) on the important topic of "Test: Frequency Domain Analysis of Control Systems- 3". These 20 questions have been designed by the experts with the latest curriculum of Electrical Engineering (EE) 2026, to help you master the concept.
Test Highlights:
- - Format: Multiple Choice Questions (MCQ)
- - Duration: 60 minutes
- - Number of Questions: 20
Sign up on EduRev for free to attempt this test and track your preparation progress.

Phase crossover frequency is defined at
The Bode plot for a transfer function is shown below:
The steady state error corresponding to a parabolic input is
The steady state error corresponding to a parabolic input is
Detailed Solution: Question 2

The frequency at which the Nyquist plot crosses the negative real axis is known as
Detailed Solution: Question 3
A unity feedback system has a forward path gain of
The phase angle of the Nyquist plot for ω → ∞ is
The phase angle of the Nyquist plot for ω → ∞ is
Detailed Solution: Question 4
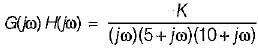

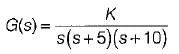
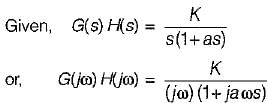
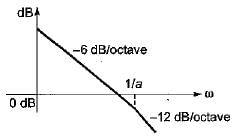
The open loop transfer function of a system is given as
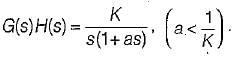
The Bode plot of this system is represented as:
The Bode plot of this system is represented as:
Detailed Solution: Question 5
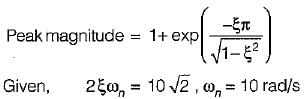
A second order system has
It’s Mp (peak magnitude) will be approximately
It’s Mp (peak magnitude) will be approximately
Detailed Solution: Question 6
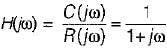
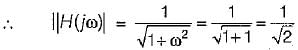
The closed loop transfer function of a control system is given by
C(s)/R(s) = 1/(1+s)
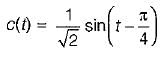
For the input r(t) = sint, the steady state value of c(t) is equal to
C(s)/R(s) = 1/(1+s)
For the input r(t) = sint, the steady state value of c(t) is equal to
Detailed Solution: Question 7

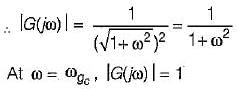
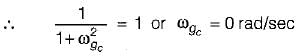
A system has transfer function equal to (1-s)/(1+s). Its gain at ω = 1 rad/s is
Detailed Solution: Question 8
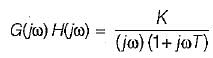
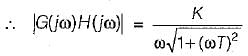
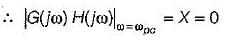
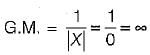
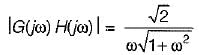
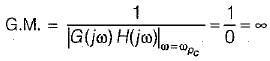
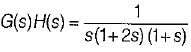
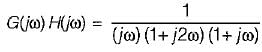
The gain margin of a unity negative feedback system having forward path transfer function

Detailed Solution: Question 9
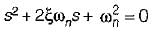
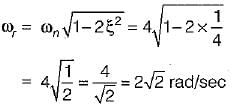
The characteristic equation of a closed loop control system is given by s2 + 4s + 16 = 0. The resonant frequency (in radian/sec) of the system is
Detailed Solution: Question 10

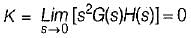
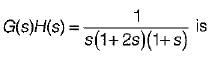
The gain margin (in dB) of a system having the open-loop transfer function
 is
is
isDetailed Solution: Question 11
The forward path transfer function of an unity feedback system is given by
What is the phase margin for this system?
What is the phase margin for this system?
Detailed Solution: Question 12
The closed loop system having the open loop transfer function,
 is
is
isDetailed Solution: Question 13
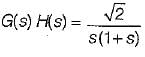
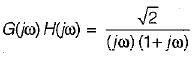
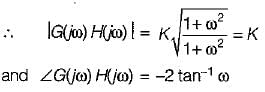
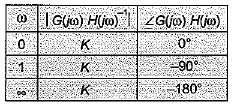
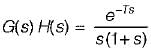
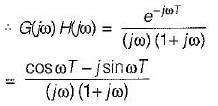
 Now,
Now,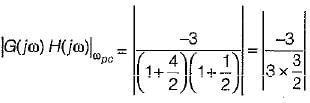
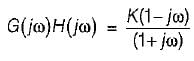
The nyquist plot for a unity feedback control system having open loop transfer function G(s) = K(1-s)/(s+1) is shown in figure below :
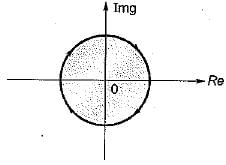
The system is
The system is
Detailed Solution: Question 14
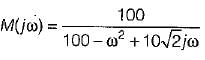
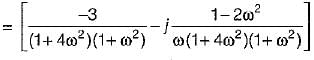
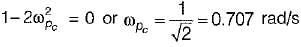
A unity feedback control system has a forward path transfer function of  Its phase value will be zero at a frequency of ω1.
Which one of the following equation should be satisfied for it?
Its phase value will be zero at a frequency of ω1.Which one of the following equation should be satisfied for it?
Detailed Solution: Question 15
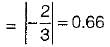
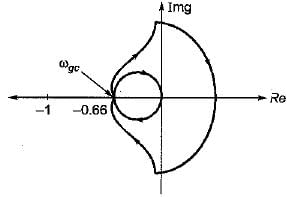
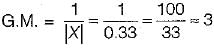
What is the approximate value of gain margin in the Nyquist diagram shown below?
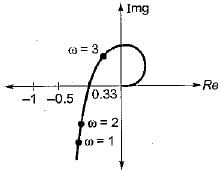
Detailed Solution: Question 16

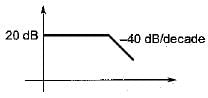
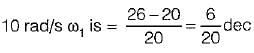
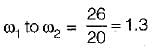
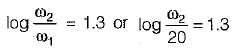
The magnitude-frequency response of a control system is given in figure below:
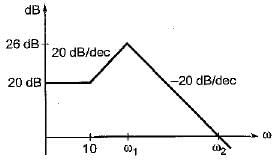
The values of ω1 and ω2 are respectively
The values of ω1 and ω2 are respectively
Detailed Solution: Question 17

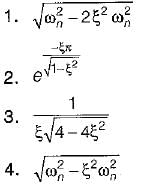
Match List-I with List-Il and select the correct answer using the codes given below the lists:
List-I
A. Resonant peak
B. Damped natural frequency (rad/s)
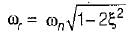
C. Resonant frequency (rad/s)
D. Peak overshoot
List - II
Codes:
A B C D
(a) 3 4 1 2
(b) 3 1 4 2
(c) 2 4 1 3
(d) 2 1 4 3
List-I
A. Resonant peak
B. Damped natural frequency (rad/s)
C. Resonant frequency (rad/s)
D. Peak overshoot
List - II
Codes:
A B C D
(a) 3 4 1 2
(b) 3 1 4 2
(c) 2 4 1 3
(d) 2 1 4 3
A second order underdamped system has a damping ratio of 0.8. It is subjected to a sinusoidal input of unit amplitude. It has resonant peak of
Detailed Solution: Question 19


Band width is the range of frequencies for which system gain is
Detailed Solution: Question 20
53 videos|125 docs|40 tests |