Test Level 1: Line Graph - CAT MCQ
10 Questions MCQ Test - Test Level 1: Line Graph

Directions: Study the following graph and answer the question that follows.
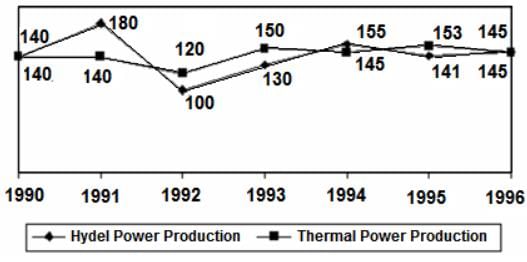
POWER PRODUCTION OF A COMPANY (IN MILLION WATTS)

Q. What is the difference between the peak hydel power production and the least Hydel Power Production ?
Q. What is the difference between the peak hydel power production and the least Hydel Power Production ?
Directions: Study the following graph and answer the question that follows.
POWER PRODUCTION OF A COMPANY (IN MILLION WATTS)

Q. In which year is the total power production (thermal + hydel) the greatest?

Directions: Study the following graph and answer the question that follows.
POWER PRODUCTION OF A COMPANY (IN MILLION WATTS)
Q. What is the average thermal power production for the period 1990-1996?
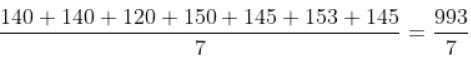 = 141.85 million watts
Directions: Study the following graph carefully and answer the question given below.
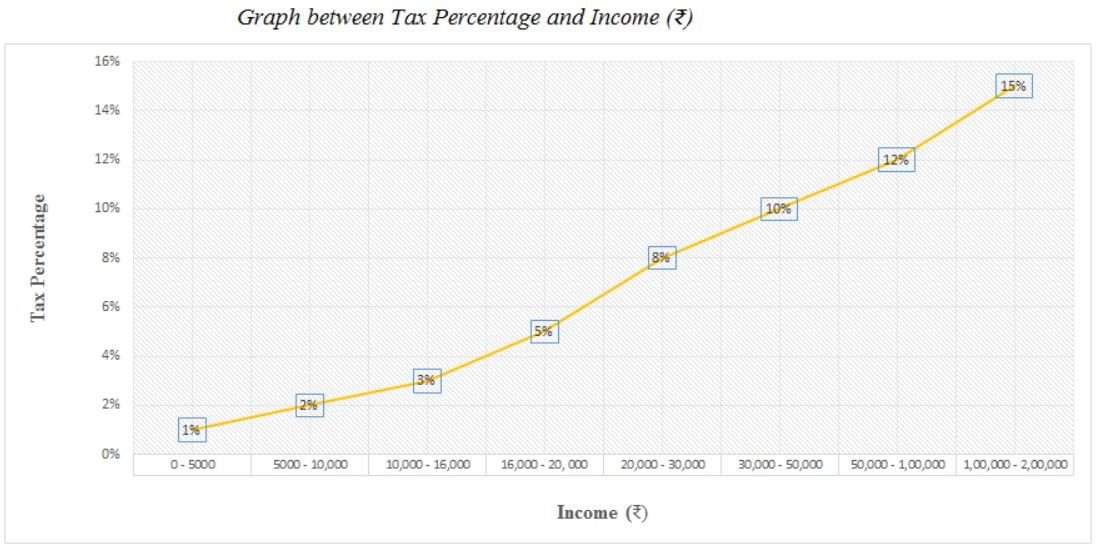
Q. If the population of a city is 35,000 and the average income of a person in that city is Rs. 25,000 per annum, then what is the total amount of tax paid by all the persons of that city?
Directions: Study the following graph carefully and answer the question given below.

Q. What is the total amount of tax on an income of Rs. 9000 and an income of Rs. 2000?
Directions: Study the following graph carefully and answer the question given below.

Q. What is the ratio of the tax on an income of Rs. 15,550 to that on an income of Rs. 16,550?
Directions: Refer to the graph and answer the following question.
The line graph below gives information about the number of applications received by different colleges A, B and C for admission to their MBA programme from 2012 to 2016.

Q. What is the ratio of the number of applications received by colleges A, B and C in 2013 to that in 2016?
Directions: Refer to the graph and answer the following question.
The line graph below gives information about the number of applications received by different colleges A, B and C for admission to their MBA programme from 2012 to 2016.

Q. What is the difference between the number of applications received by college C during 2013-2016 and that received by college A during 2012-2015?
Directions: Refer to the graph and answer the following question.
The line graph below gives information about the number of applications received by different colleges A, B and C for admission to their MBA programme from 2012 to 2016.
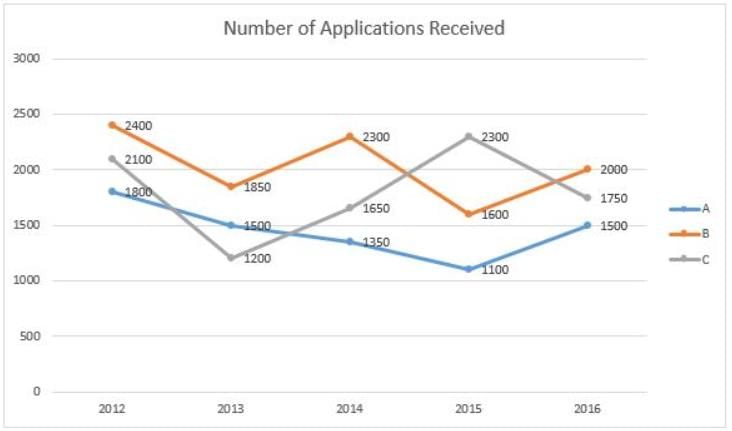
Q. Out of total applications received by colleges A, B and C in 2014, 40% were shortlisted by college A, 35% were shortlisted by college B and 60% were shortlisted by college C for further rounds. How many applicants were shortlisted by colleges A, B and C together in 2014?
Directions: Refer to the graph and answer the following question.
The line graph below gives information about the number of applications received by different colleges A, B and C for admission to their MBA programme from 2012 to 2016.
Q. Total applications received by college A in years 2012, 2013 and 2014 are what percent (approximately) of those received by college B in years 2014, 2015 and 2016?
Important Questions for Test Level 1: Line Graph
Test Level 1: Line Graph MCQs with Answers
Online Tests for Test Level 1: Line Graph
|
© EduRev
|
Education Revolution
|


|


