Test Level 1: Mixed Graphs - CAT MCQ
10 Questions MCQ Test - Test Level 1: Mixed Graphs

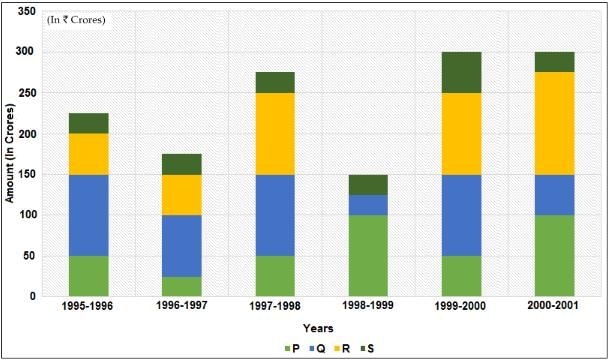
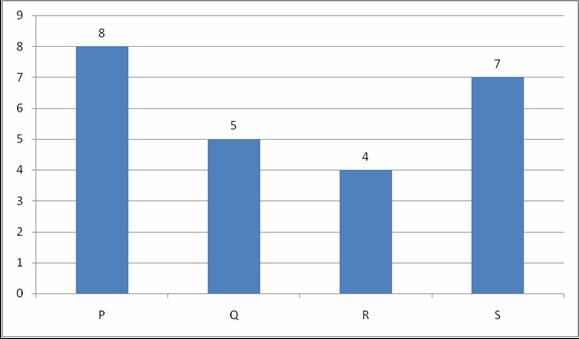
Directions: Study the following stacked bar graph which represents the advertisement expenditure of a trading company from 1995 - 96 to 2000 - 01 on its products P, Q, R and S.

Note: Sales for the given years are as follows:
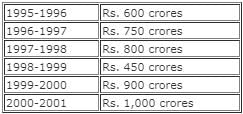
Profit = Sales - Advertising Expenditure
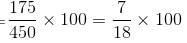
Q. The advertising expenditure of product S as a percentage of the advertising expenditure of P and R together is least in which of the following years?
Note: Sales for the given years are as follows:
Profit = Sales - Advertising Expenditure
Directions: Study the following stacked bar graph which represents the advertisement expenditure of a trading company from 1995 - 96 to 2000 - 01 on its products P, Q, R and S.
Note: Sales for the given years are as follows:

Profit = Sales - Advertising Expenditure
Q. If the ratio of sales of the products P, Q, R and S in the year 2000 - 01 is 2 : 5 : 1 : 2, then the profit of S is what percentage of the profit of Q in the same year?
Note: Sales for the given years are as follows:
Profit = Sales - Advertising Expenditure

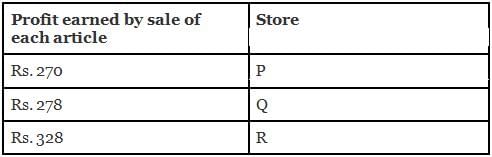
Directions: The given table gives information about the number of articles sold by store P, Q and R from August to November and the profit earned by each store by selling each article. Answer the question that follows.

Q. The total articles sold by stores P and Q from August to October is what percent more than total articles sold by store R from August to October?
Directions: The given table gives information about the number of articles sold by store P, Q and R from August to November and the profit earned by each store by selling each article. Answer the question that follows.
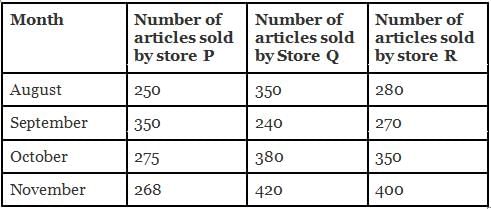

Q. What is the difference between the profit of all three stores in the month of September and the profit of stores Q and R in October from the sale of article?
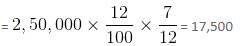
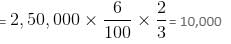
Directions: In the recently concluded UP Elections, a total of 2,50,000 e-votes were casted from 8 different cities mentioned below in the pie-chart. The table shows the ratio of e-votes received by BJP to SP.

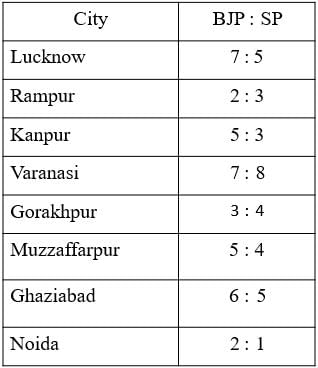
Q. What is the ratio of e-votes received by BJP in Lucknow to those in Noida?
Directions: In the recently concluded UP Elections, a total of 2,50,000 e-votes were casted from 8 different cities mentioned below in the pie-chart. The table shows the ratio of e-votes received by BJP to SP.
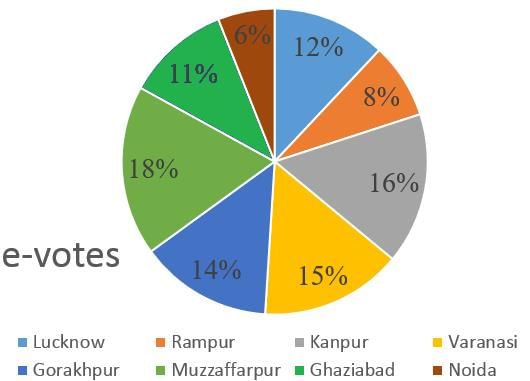

Q. What is the ratio of the total number of e-votes cast to BJP in Kanpur and Varanasi to the total number of e-votes cast to SP in the same two cities?
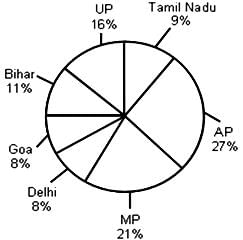
Directions: The pie chart given below shows the percentage population of seven different states in a particular year. The table shows sex and literacy ratios. Based on the given information, answer the following question:

Total population of the given states = 32,76,000
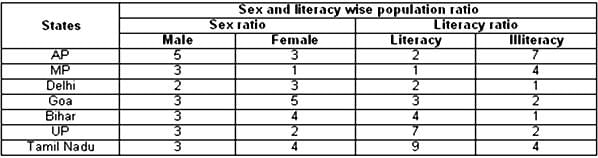
Q. What is the ratio of the number of females in Tamil Nadu to that in Delhi?
Directions: The pie chart given below shows the percentage population of seven different states in a particular year. The table shows sex and literacy ratios. Based on the given information, answer the following question:
Total population of the given states = 32,76,000

Q. What was the total number of illiterate people in AP and MP?
Directions: Read the following information carefully to answer the question that follows.
Cost of different ingredients (in Rs./g) used in making food products:

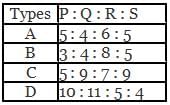
Ratio of ingredients in each type of food products:
Total cost of food products = Rs. 15 (making charges per food product) + ingredients cost
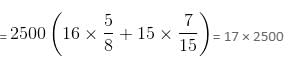
Q. What is the total cost of 500 g of type A and 600 g of type B food products?
Directions: Read the following information carefully to answer the question that follows.
Cost of different ingredients (in Rs./g) used in making food products:
Ratio of ingredients in each type of food products:

Total cost of food products = Rs. 15 (making charges per food product) + ingredients cost
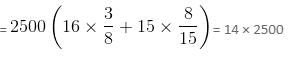
Q. What is the total cost of ingredients in 600 g food products of type B and 1200 g food of type C?
Important Questions for Test Level 1: Mixed Graphs
Test Level 1: Mixed Graphs MCQs with Answers
Online Tests for Test Level 1: Mixed Graphs
|
© EduRev
|
Education Revolution
|


|


