Test Level 1: Pie Chart - CAT MCQ
20 Questions MCQ Test - Test Level 1: Pie Chart

Directions: Study the given information carefully and answer the following question.
The following pie chart shows the distribution of employees (in %) working in different departments of a company.
Total number of employees = 2400
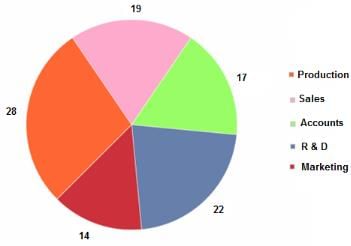
What is the total number of employees working in Accounts, Production and Marketing?
The following pie chart shows the distribution of employees (in %) working in different departments of a company.
Total number of employees = 2400
Directions: Study the following information and answer the question that follows.
The percentage of employees in various departments in company A is as shown below.
There are 1800 employees in total.
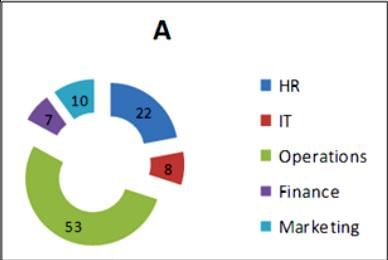
How many employees are there in marketing and finance departments?
The percentage of employees in various departments in company A is as shown below.
There are 1800 employees in total.

Directions: Answer the given question based on the following information.
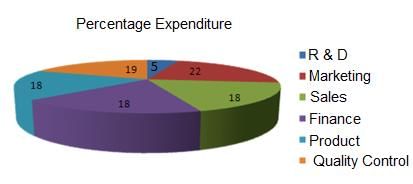
The pie chart below shows the expenditure of a company on different sectors.
Total budget of the company = Rs. 1660 crore

What is the average expenditure on marketing and sales?
The pie chart below shows the expenditure of a company on different sectors.
Total budget of the company = Rs. 1660 crore

Directions: Answer the given question based on the following information.
The pie chart below shows the expenditure of a company on different sectors.
Total budget of the company = Rs. 1660 crore
What is the total expenditure on marketing, sales and finance?
Directions: Answer the given question based on the following information.
The pie chart below shows the expenditure of a company on different sectors.
Total budget of the company = Rs. 1660 crore

What is the expenditure on R & D?
Directions: Study the following pie charts and answer the question.
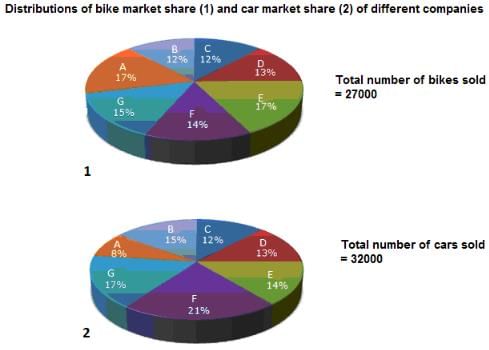
What is the total number of bikes and cars sold by company F?
Directions: Study the following pie charts and answer the question.

Total number of bikes sold by companies A, B and C is
Directions: Study the following pie charts and answer the question.

What is the ratio of the number of bikes to that of cars sold by company E?
Directions: Study the following pie charts and answer the question.

What is the percentage of bikes sold by company G to the total sale of bikes and cars by all companies?
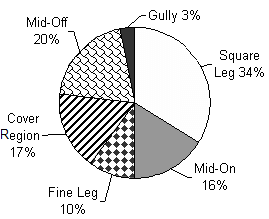
Directions: The question is based on the following graph.
Pattern of Runs Scored by Lara in a Series of Six Test Matches.
Note : Runs scored are calculated to nearest whole number.
Total Runs = 664

From the pattern of the runs scored, Lara is strongest in which of the following regions?
Directions: The question is based on the following graph.
Pattern of Runs Scored by Lara in a Series of Six Test Matches.
Note : Runs scored are calculated to nearest whole number.
Total Runs = 664

Runs scored in the gully region form what percentage of runs scored in the fine leg region?
Directions: The question is based on the following graph.
Pattern of Runs Scored by Lara in a Series of Six Test Matches.
Note : Runs scored are calculated to nearest whole number.
Total Runs = 664
Had Lara struck four more 4's in the cover region(provided all other percentages remain same), the percentage of runs he scored in the cover region as a percentage of total runs would have been
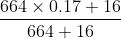 × 100 = 18.95%
Directions: The question is based on the following graph.
Pattern of Runs Scored by Lara in a Series of Six Test Matches.
Note : Runs scored are calculated to nearest whole number.
Total Runs = 664

If Lara's average before the beginning of the first test of the series was 50.84 in 90 innings and he played a total of 11 innings in this series, the average score per innings of Lara at the end of the series was
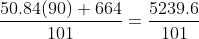 = 51.9
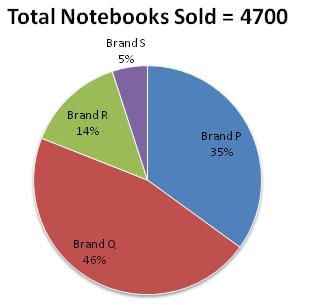
Directions: The following pie charts give information about the percentage distribution of total notebooks of different brands sold by a book store during different months and the percentage distribution of profit earned from the sale of each brand:


If the book store offered 20% discount on brand P notebooks and earned 20% profit, then what was the marked price per notebook of brand P?
Directions: The following pie charts give information about the percentage distribution of total notebooks of different brands sold by a book store during different months and the percentage distribution of profit earned from the sale of each brand:
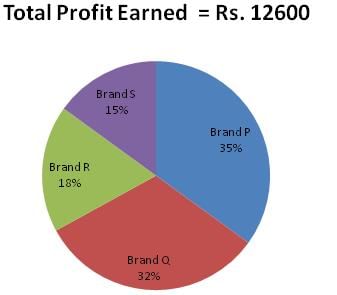
The profit earned per notebook of brand Q is what percent of the profit earned per notebook of brand R?
Directions: The following pie charts give information about the percentage distribution of total notebooks of different brands sold by a book store during different months and the percentage distribution of profit earned from the sale of each brand:
If each notebook of brand S was sold at a 25% profit after offering a 30% discount, then what was its marked price?
Directions: Study the given pie chart carefully and answer the following question.
The following pie chart shows the total number of cars sold by eight car companies during the year 2016:

If the total number of cars sold by Ferrari was 44,000, then what was the difference between the total number of cars sold by Bugatti and that sold by Porsche?
 = 31,680
Directions: Study the given pie chart carefully and answer the following question.
The following pie chart shows the total number of cars sold by eight car companies during the year 2016:

What is the ratio of 20% of the total cars sold by Land Rover to 50% of the total cars sold by Audi?


 : 5
: 5 
Directions: Study the given pie chart carefully and answer the following question.
The following pie chart shows the total number of cars sold by eight car companies during the year 2016:
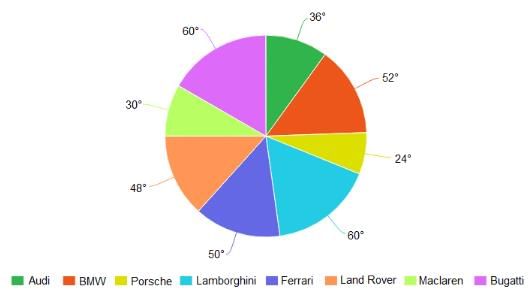
If the number of cars sold by Maclaren is 36,000, then what is the sum of two-thirds of the cars sold by BMW and nine-tenths of the cars sold by Lamborghini?

Directions: Study the given pie chart carefully and answer the following question.
The following pie chart shows the total number of cars sold by eight car companies during the year 2016:

What percent more cars were sold by Ferrari and Land Rover together than sold by Porsche and Lamborghini together?


 = 16.67%
Important Questions for Test Level 1: Pie Chart
Test Level 1: Pie Chart MCQs with Answers
Online Tests for Test Level 1: Pie Chart
|
© EduRev
|
Education Revolution
|


|


within 7 days!