Test Level 2: Missing Data - CAT MCQ
10 Questions MCQ Test - Test Level 2: Missing Data

Directions: Study the table carefully and answer the following question.

Q. If the ratio of the number of selected candidates by Company P in 2009 to that in 2010 is 16 : 9, what is the number of selected candidates by Company P in 2010?
Directions: Study the table carefully and answer the following question.
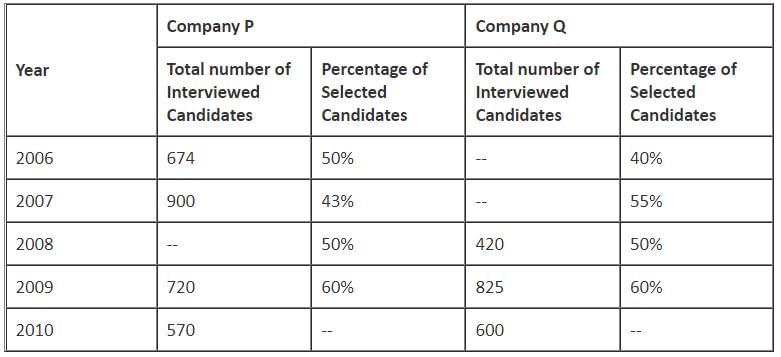
Q. What is the difference between the number of selected candidates by Company P in 2007 and that in 2006?

Directions: Study the table carefully and answer the following question.

Q. If the average number of selected candidates in Company Q in 2008, 2009 and 2010 is 315, what is the number of selected candidates from College Q in 2010?
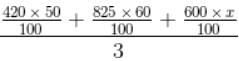 = 315
= 315The table shows the number of appeared and qualified candidates (in thousands) in a competitive examination from different states over the years.
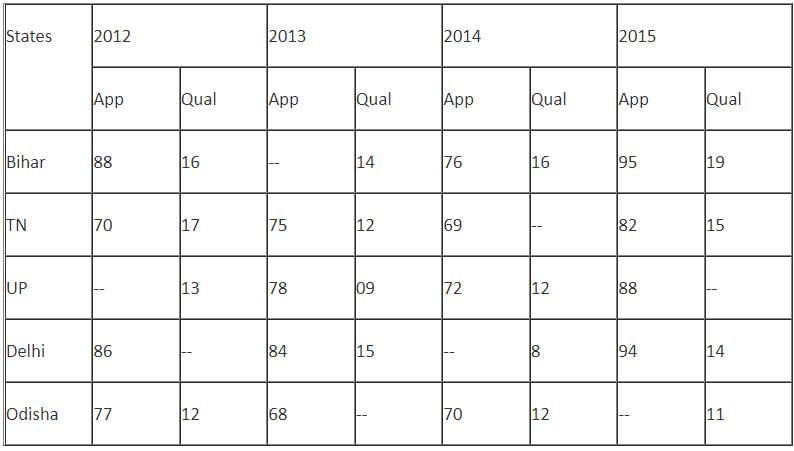
Q. If the average number of appeared candidates from UP is 79 thousand and the average number of qualified candidates from UP is equal to the qualified candidates from Delhi in 2015, then what is the ratio of appeared candidates from UP in 2012 to that of the qualified candidates from UP in 2015?
The table shows the number of appeared and qualified candidates (in thousands) in a competitive examination from different states over the years.

Q. In 2016, the number of appeared candidates from Bihar, TN and Delhi increased by 20%, 15% and 12% from the previous year, respectively and the number of appeared candidates in 2016 from UP and Odisha decreased by 5% and 4%, respectively. What is the total number of appeared candidates in 2016 from all the given states, if the number of appeared candidates from Odisha in 2015 is equal to 12% more than that of appeared candidates from TN in 2013?
The table shows the number of appeared and qualified candidates (in thousands) in a competitive examination from different states over the years.

Q. If in 2013, the number of appeared candidates from Bihar is 9 thousand more than the number of appeared candidates from Odisha in 2012 and the number of qualified candidates from Odisha in 2013 is 125% of qualified candidates from Odisha in 2012, then the number of qualified candidates in 2013 from all the states is what (approximate) percent of that of appeared candidates from all the states in that year?
Directions: Study the data given below and answer the following question.
Five manufacturers P, Q, R, S and T are selling four different products given in the table below. The table contains profit percentages gained on the cost price of these products by different manufacturers (after discount, if any)

Note:
1. The missing values can be calculated using the data given in the question.
2. Cost price of a particular product is the same for all the manufacturers, unless specified.
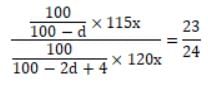
Q. If the respective ratio of marked prices of product II by sellers R and T is 23 : 24, the discount percentage offered by manufacturer R on selling product II is d% and that offered by manufacturer T on selling the same product is (2d - 4)%, then find the value of d.
Directions: Study the data given below and answer the following question.
Five manufacturers P, Q, R, S and T are selling four different products given in the table below. The table contains profit percentages gained on the cost price of these products by different manufacturers (after discount, if any)
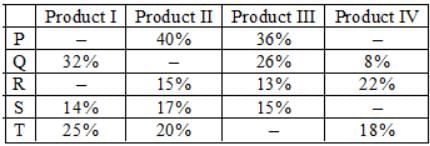
Note:
1. The missing values can be calculated using the data given in the question.
2. Cost price of a particular product is the same for all the manufacturers, unless specified.
Q. The average selling price of product IV by manufacturers R and S is Rs. 1360, and that by manufacturers S and T is Rs. 1340. Find the selling price of product IV by manufacturer S.
Directions: Study the table given below and answer the following question.
The Prime Minister of India distributed grains (in tonnes) in different states of India to gain a position in next election. The data of distribution is as follows:
(Total grains distributed = 30,000 tonnes)
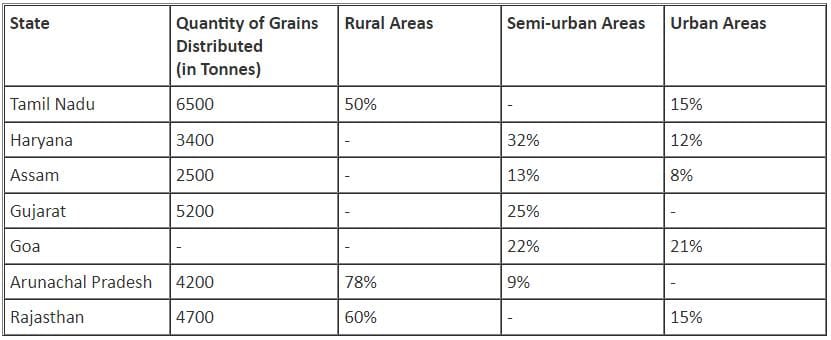
Q. What is the difference between the total distribution of grains in Tamil Nadu and that in Goa and Arunachal Pradesh together?
Directions: Study the table given below and answer the following question.
The Prime Minister of India distributed grains (in tonnes) in different states of India to gain a position in next election. The data of distribution is as follows:
(Total grains distributed = 30,000 tonnes)
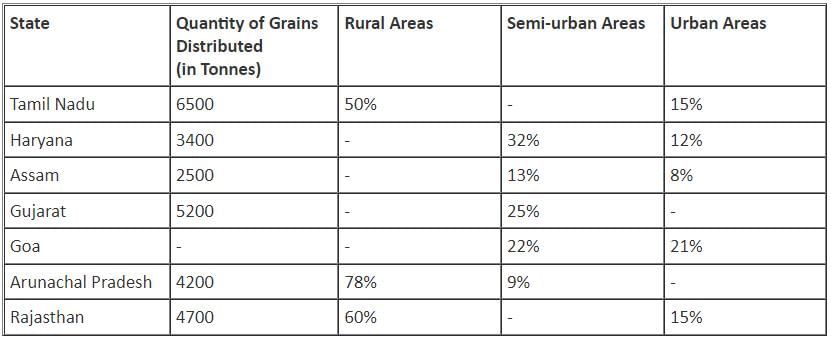
Q. What percentage of the total distribution of grains in all the states together is the total distribution of grains in rural areas of all the states together, excluding Gujarat?
Important Questions for Test Level 2: Missing Data
Test Level 2: Missing Data MCQs with Answers
Online Tests for Test Level 2: Missing Data
|
© EduRev
|
Education Revolution
|


|


within 7 days!