Test Level 2: Mixed Graphs - CAT MCQ
15 Questions MCQ Test - Test Level 2: Mixed Graphs

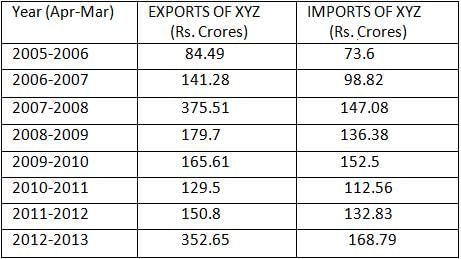
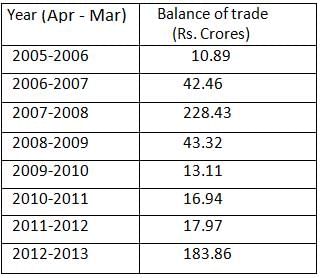
Directions: Answer the question on the basis of the tables given below.
XYZ is a China based company which deals in import and export of mobile phones to America. Following are the details of its dealings.
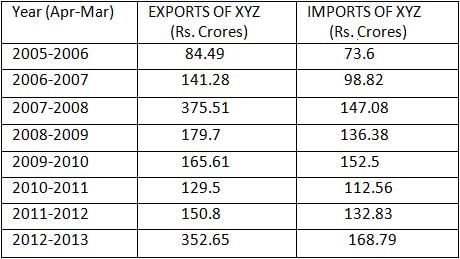
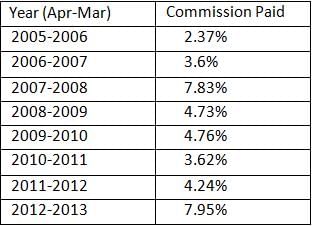
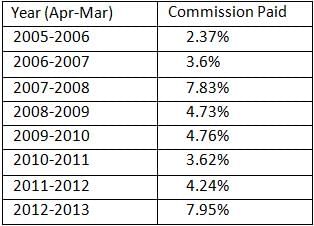
Given below are the details of the commission that XYZ paid to its American agent as a percentage of its total trade. The commission rate changes at the same rate as the total trade.
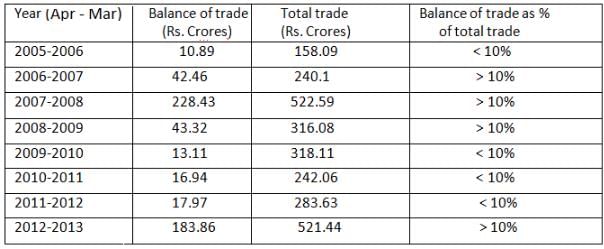
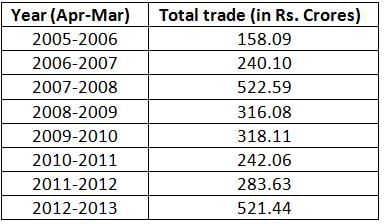
Total trade = Imports + Exports
Balance of trade = Exports - Imports
Q. How many times has the balance of trade been more than 10% of the total trade?
XYZ is a China based company which deals in import and export of mobile phones to America. Following are the details of its dealings.
Given below are the details of the commission that XYZ paid to its American agent as a percentage of its total trade. The commission rate changes at the same rate as the total trade.
Total trade = Imports + Exports
Balance of trade = Exports - Imports
Directions: Answer the question on the basis of the tables given below.
XYZ is a China based company which deals in import and export of mobile phones to America. Following are the details of its dealings.

Given below are the details of the commission that XYZ paid to its American agent as a percentage of its total trade. The commission rate changes at the same rate as the total trade.

Total trade = Imports + Exports
Balance of trade = Exports - Imports
Q. In which of the following years did the American agent receive the highest commission?
XYZ is a China based company which deals in import and export of mobile phones to America. Following are the details of its dealings.
Given below are the details of the commission that XYZ paid to its American agent as a percentage of its total trade. The commission rate changes at the same rate as the total trade.
Total trade = Imports + Exports
Balance of trade = Exports - Imports

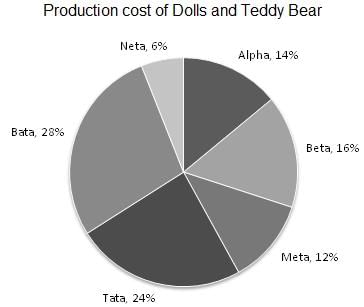
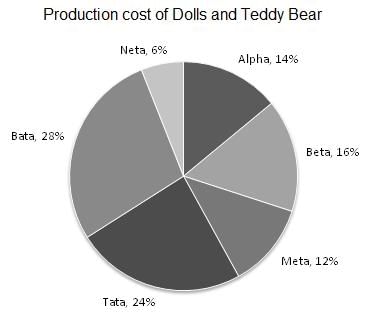
Directions: Study the following pie-chart and table carefully and answer the question that follows.
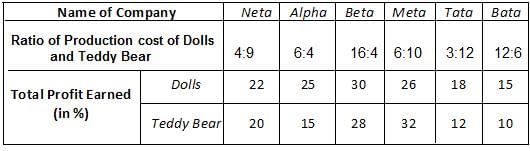
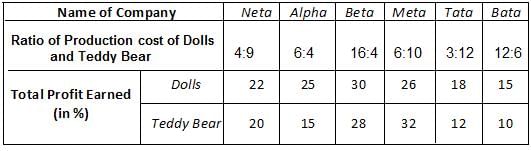
The given pie-chart represents data about the production (in %) of Dolls and Teddy Bears under 7 various companies, named Neta, Alpha, Beta, Meta, Tata and Bata. The table represents the ratio of production amidst Dolls and Teddy Bears for given companies. Also, the profit % is also delineated in the following table for both the products.
Production cost = Rs. 25 Crore

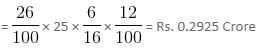
Q. Calculate the sum of the amount of profit earned by Meta on the production of Dolls and profit earned by Tata on the production of Teddy Bears.
The given pie-chart represents data about the production (in %) of Dolls and Teddy Bears under 7 various companies, named Neta, Alpha, Beta, Meta, Tata and Bata. The table represents the ratio of production amidst Dolls and Teddy Bears for given companies. Also, the profit % is also delineated in the following table for both the products.
Production cost = Rs. 25 Crore
Directions: Study the following pie-chart and table carefully and answer the question that follows.
The given pie-chart represents data about the production (in %) of Dolls and Teddy Bears under 7 various companies, named Neta, Alpha, Beta, Meta, Tata and Bata. The table represents the ratio of production amidst Dolls and Teddy Bears for given companies. Also, the profit % is also delineated in the following table for both the products.
Production cost = Rs. 25 Crore

Q. The amount of production of Dolls by Tata is what percent of the amount of production of Teddy Bears by Alpha?
Directions: Study the information given below and answer the following question.
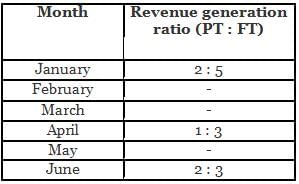
The pie charts show the expenditure of a company on salaries of part-time and full-time employees for the first 6 months and the table shows the ratio of revenues generated by part-time employees to that by full-time employees in six months. Profit/loss is calculated as difference between revenue and expenditure, where the only expenditure incurred is in the form of salaries, as the rest is 100% subsidised by the government.
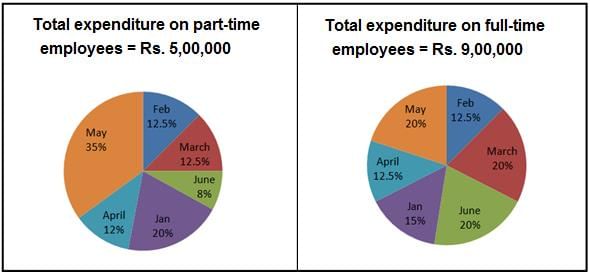
Q. What was the overall profit percentage in June, if the revenue generated by part-time employees was Rs. 1,32,000?
Directions: Study the following data and answer the question below.
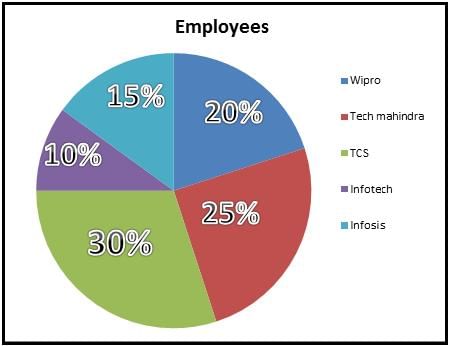
The pie chart below gives the percentage of employees working in each company, where the total number of employees is 1,00,000.

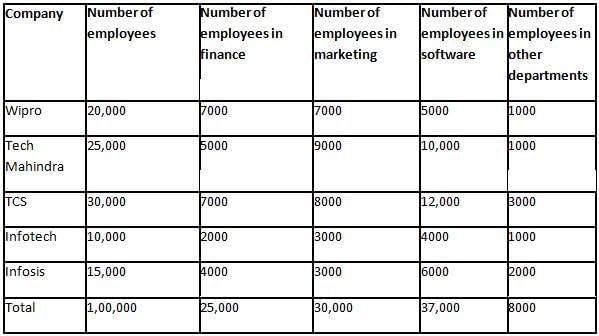
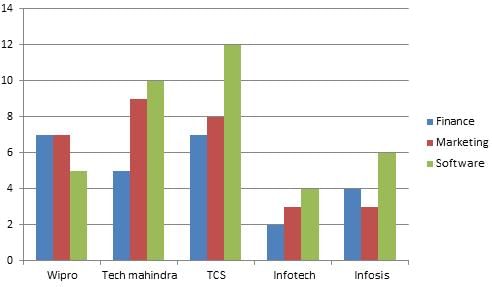
The bar chart below gives information about the number of employees working in finance, software and marketing departments in each company (value in 1000).

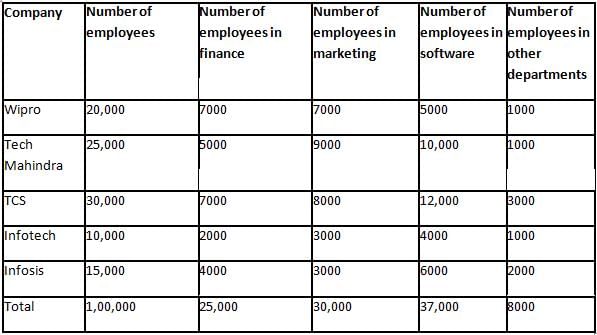
Some employees work in other departments (i.e. not working in finance, marketing and software departments) of each company. Employees working in other departments of a company = Total number of employees in that company - Total number of employees working in finance, marketing and software departments of that company.
The ratio of male to female employees in finance department is 4 : 3.
The ratio of male to female employees in marketing department is 5 : 3.
The ratio of male to female employees in software department is 3 : 5.
The ratio of male to female employees in other departments is 2 : 3.
Q. The average number of employees in finance department of all the companies is
Directions: Study the following data and answer the question below.
The pie chart below gives the percentage of employees working in each company, where the total number of employees is 1,00,000.
The bar chart below gives information about the number of employees working in finance, software and marketing departments in each company (value in 1000).
Some employees work in other departments (i.e. not working in finance, marketing and software departments) of each company. Employees working in other departments of a company = Total number of employees in that company - Total number of employees working in finance, marketing and software departments of that company.
The ratio of male to female employees in finance department is 4 : 3.
The ratio of male to female employees in marketing department is 5 : 3.
The ratio of male to female employees in software department is 3 : 5.
The ratio of male to female employees in other departments is 2 : 3.
Q. The sum of the numbers of employees in finance and software departments of Infosis and marketing department of Infotech is
Directions: The pie chart below shows percentage distribution of sale of 3600 books across five different subject categories by a book shop during the year 2008 and the table gives the information about the price of a book (in Rs.) written by three authors in each category.
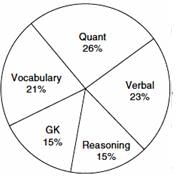
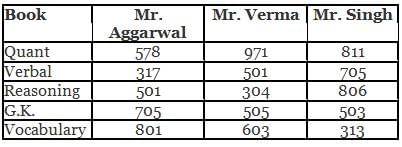
Q. If all the 3600 books that were sold by the book shop were written by only one author, i.e. Mr. Aggarwal, then what was the total income of the book shop through sale of all 3600 books in 2008?
Directions: Study the following pie-charts and table carefully and answer accordingly.
The following pie charts show the number of wickets taken by a bowler against different countries in ODI and Test Matches.
Total number of wickets taken by the bowler in ODI and Test matches is 500 and 400, respectively.
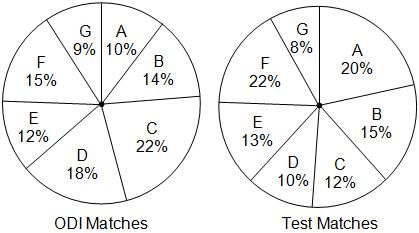
The following table shows the number of runs conceded against different countries in ODI and Test Matches.
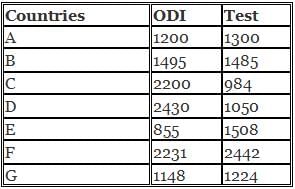
Note: Strike rate of a bowler is defined as the runs conceded per wicket.
Q. Against which of the following countries is the difference in ODI and Test wickets the maximum?
Directions: Study the following pie-charts and table carefully and answer accordingly.
The following pie charts show the number of wickets taken by a bowler against different countries in ODI and Test Matches.
Total number of wickets taken by the bowler in ODI and Test matches is 500 and 400, respectively.

The following table shows the number of runs conceded against different countries in ODI and Test Matches.

Note: Strike rate of a bowler is defined as the runs conceded per wicket.
Q. Against which two countries did the bowler take the same numbers of wickets in ODI and Test Matches, respectively?
Directions: Answer the question on the basis of the tables given below.
XYZ is a China based company which deals in import and export of mobile phones to America. Following are the details of its dealings.
Given below are the details of the commission that XYZ paid to its American agent as a percentage of its total trade. The commission rate changes at the same rate as the total trade.

Total trade = Imports + Exports
Balance of trade = Exports - Imports
Q. When has there been the least positive growth in the balance of trade?
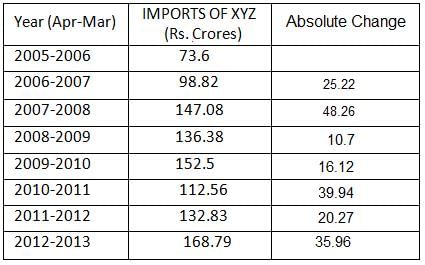
Directions: Answer the question on the basis of the tables given below.
XYZ is a China based company which deals in import and export of mobile phones to America. Following are the details of its dealings.

Given below are the details of the commission that XYZ paid to its American agent as a percentage of its total trade. The commission rate changes at the same rate as the total trade.
Total trade = Imports + Exports
Balance of trade = Exports - Imports
Q. What has been the maximum percentage change in the imports of XYZ over the previous year?
Directions: Study the following pie-chart and table carefully and answer the question that follows.
The given pie-chart represents data about the production (in %) of Dolls and Teddy Bears under 7 various companies, named Neta, Alpha, Beta, Meta, Tata and Bata. The table represents the ratio of production amidst Dolls and Teddy Bears for given companies. Also, the profit % is also delineated in the following table for both the products.
Production cost = Rs. 25 Crore

Q. Calculate the ratio of amount gathered on production of Dolls by Alpha to the amount gathered on production of Dolls by Beta.
Directions: Study the following pie-chart and table carefully and answer the question that follows.
The given pie-chart represents data about the production (in %) of Dolls and Teddy Bears under 7 various companies, named Neta, Alpha, Beta, Meta, Tata and Bata. The table represents the ratio of production amidst Dolls and Teddy Bears for given companies. Also, the profit % is also delineated in the following table for both the products.
Production cost = Rs. 25 Crore

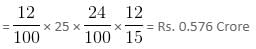
Q. Calculate the amount for the profit attained by Bata on production of Teddy Bears.
Directions: Study the information given below and answer the following question.
The pie charts show the expenditure of a company on salaries of part-time and full-time employees for the first 6 months and the table shows the ratio of revenues generated by part-time employees to that by full-time employees in six months. Profit/loss is calculated as difference between revenue and expenditure, where the only expenditure incurred is in the form of salaries, as the rest is 100% subsidised by the government.


Q. If in March, the ratio of revenue generated by part-time employees to that by full-time employees was 1 : 3 and if the total revenue generated by full-time employees was Rs. 7,21,875, then what was the percentage of total profit to the total expenditure on full-time employees of that month?


Important Questions for Test Level 2: Mixed Graphs
Test Level 2: Mixed Graphs MCQs with Answers
Online Tests for Test Level 2: Mixed Graphs
|
© EduRev
|
Education Revolution
|


|


