Test Level 2: Table - CAT MCQ
20 Questions MCQ Test - Test Level 2: Table

Directions: Study the following information and answer the question that follows.
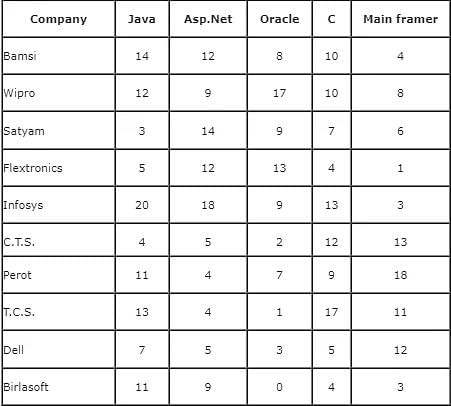
The table below represents the number of software projects on different domains that were done in different companies in 2006.

There were no other projects done by these companies, except those given above.
How many companies did more projects than Flextronics?
The table below represents the number of software projects on different domains that were done in different companies in 2006.
There were no other projects done by these companies, except those given above.
Directions: Study the following information and answer the question that follows.
The table below represents the number of software projects on different domains that were done in different companies in 2006.

There were no other projects done by these companies, except those given above.
If each company got 10% more total projects in the next year, i.e. 2007, as compared to 2006, then how many companies would get more than 50 projects in 2007?
The table below represents the number of software projects on different domains that were done in different companies in 2006.
There were no other projects done by these companies, except those given above.

Directions: Study the following information and answer the question that follows.
The table below represents the number of software projects on different domains that were done in different companies in 2006.

There were no other projects done by these companies, except those given above.
In 2005, the number of projects of each company was 20% less than that in 2006, how many companies got at the most 30 projects in 2005?
The table below represents the number of software projects on different domains that were done in different companies in 2006.
There were no other projects done by these companies, except those given above.
Directions: Study the following information and answer the question that follows.
The table below represents the number of software projects on different domains that were done in different companies in 2006.
There were no other projects done by these companies, except those given above.
How many companies did less Java projects than Birlasoft in 2006?
Directions: Refer to the table below and answer the following question.
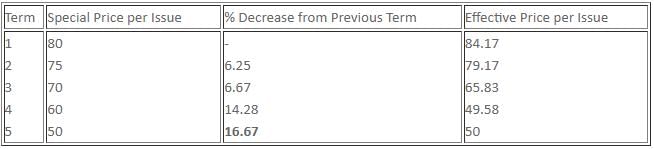
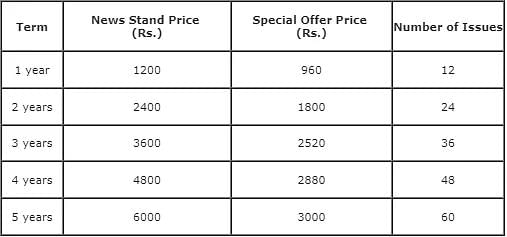
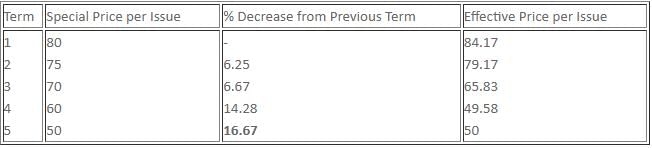
The table gives the terms of subscriptions for a magazine.

Conditions:
1. If you subscribe for 1–3 years, postage = Rs. 50 per year of subscription.
2. For a subscription of 3 years, you receive a gift worth Rs. 300.
3. For a subscription of 4 years, you receive a special gift worth Rs. 500.
4. For a subscription of 5 years, you get additional 12 issues for the 6th year, as a special gift.
5. Effective cost = Special Offer Price – Cost of gifts + Cost of postage
The % decrease in Special Offer Price per issue from one term to the next is maximum for
Directions: Refer to the table below and answer the following question.
The table gives the terms of subscriptions for a magazine.
Conditions:
1. If you subscribe for 1–3 years, postage = Rs. 50 per year of subscription.
2. For a subscription of 3 years, you receive a gift worth Rs. 300.
3. For a subscription of 4 years, you receive a special gift worth Rs. 500.
4. For a subscription of 5 years, you get additional 12 issues for the 6th year, as a special gift.
5. Effective cost = Special Offer Price – Cost of gifts + Cost of postage
What is the approximate difference in the effective cost per issue between a subscription for 2 years and subscription for 5 years?
Directions: Refer to the table below and answer the following question.
The table gives the terms of subscriptions for a magazine.

Conditions:
1. If you subscribe for 1–3 years, postage = Rs. 50 per year of subscription.
2. For a subscription of 3 years, you receive a gift worth Rs. 300.
3. For a subscription of 4 years, you receive a special gift worth Rs. 500.
4. For a subscription of 5 years, you get additional 12 issues for the 6th year, as a special gift.
5. Effective cost = Special Offer Price – Cost of gifts + Cost of postage
The Special Offer Price as a percentage of News Stand Price is minimum for which subscription?
Directions: Refer to the table below and answer the following question.
The table gives the terms of subscriptions for a magazine.

Conditions:
1. If you subscribe for 1–3 years, postage = Rs. 50 per year of subscription.
2. For a subscription of 3 years, you receive a gift worth Rs. 300.
3. For a subscription of 4 years, you receive a special gift worth Rs. 500.
4. For a subscription of 5 years, you get additional 12 issues for the 6th year, as a special gift.
5. Effective cost = Special Offer Price – Cost of gifts + Cost of postage
What is the ratio of Effective Price to News Stand Price per issue, for a subscription of 4 years?

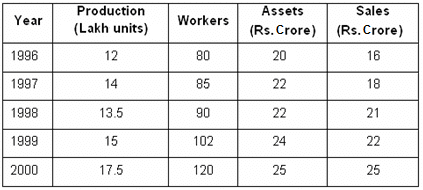
Directions: Answer the question based on the data provided in the table given below:

Asset Utilisation Factor (AUF) = Sales value/Assets
Worker productivity = Production of units/Number of workers
Assume that whatever was produced in a given year was sold in the same year.
All sales were of produced units only.
In which year was worker productivity the highest?
 = 15,000
 ~ 16,471
 = 15,000
 ~ 14,706
 ~ 14,583
Directions: Answer the question based on the data provided in the table given below:
Asset Utilisation Factor (AUF) = Sales value/Assets
Worker productivity = Production of units/Number of workers
Assume that whatever was produced in a given year was sold in the same year.
All sales were of produced units only.
What should be the selling price per unit in 2001 for 15 lakh units produced in 2001, such that the average selling price/unit of the sold units from 1996 to 2001 was 13.55% more than their average selling price/unit from 1996 to 2000?
 = Rs. 141.66 per unit
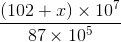 =
= 
 = Rs. 253/unit (approx.)
Directions: Answer the question based on the data provided in the table given below:

Asset Utilisation Factor (AUF) = Sales value/Assets
Worker productivity = Production of units/Number of workers
Assume that whatever was produced in a given year was sold in the same year.
All sales were of produced units only.
Worker turnover is defined as the average sales (value) per worker in a given year. The worker turnover from 1996 to 1998 was what percent of the that from 1997 to 1999?
 crore per worker
 crore per worker
 97.96%
Directions: Study the following information carefully and answer the given question.
Below are given percentages of marks in different subjects for different persons.

What are the overall marks of A in all of the examinations?
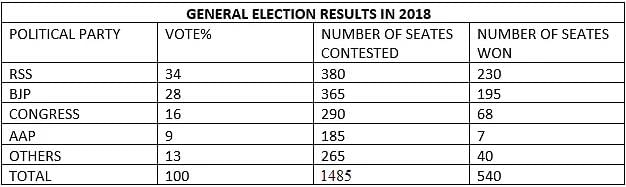
Directions: Study the following information and answer the question.

Success Rate = (Number of seats won/ Number of seats contested) x 100
What is the difference between the number of votes polled for AAP and RSS if 50 crore people were eligible to vote and 27% of them cast their votes?
Directions: Study the following information and answer the question.
Success Rate = (Number of seats won/ Number of seats contested) x 100
RSS and AAP had fought against each other for 135 seats and no third party could win any of them. If they had entered into a pre-poll alliance, what would have been the combined success rate of RSS and AAP?
Directions: Study the following information and answer the question.

Success Rate = (Number of seats won/ Number of seats contested) x 100
If a total of 45.6 crore people were eligible to vote and 63% of them cast their vote in the year 2018, then in the next general elections which are held in 2022, the number of eligible voters increases by 12%, and 65% of voters cast their votes. If the vote share of Congress increases to 18.5%, what is the percentage increase in the number of votes polled for Congress?
 x 100 = 33.48% = 34% (approx.)
Directions: Study the following information and answer the question.

Success Rate = (Number of seats won/ Number of seats contested) x 100
If a total of 45.6 crore people were eligible to vote and 63% of them cast their vote, what was the difference between the number of votes polled for BJP and Congress?
Directions: Study the following information carefully and answer the given question.
Below are given percentages of marks in different subjects for different persons.

What are the average marks obtained by all the students in Fluid Mechanics?
Directions: Study the following information carefully and answer the given question.
Below are given percentages of marks in different subjects for different persons.
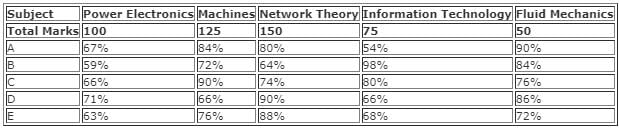
In order to pass in subject Machines, a minimum of 85 marks has to be obtained. How many students passed in this subject?
Directions: Study the following table carefully and answer the given question.
The number of participants who participated and got selected in a TV reality show screening, conducted in 5 different cities of Pakistan over the years is given below in the table:
Participants Participated (PAR) and Selected (SEL) Each Year
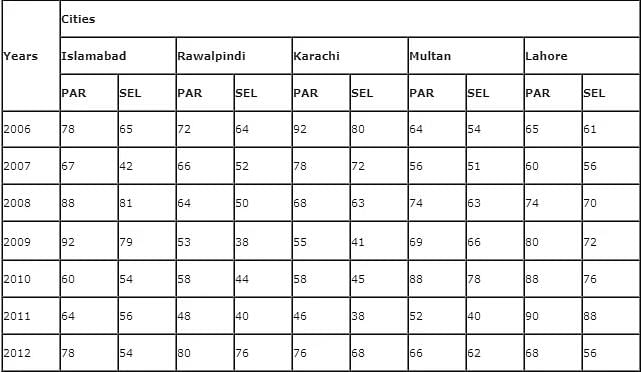
If the total number of participants from all the cities in 2013 increased by approximately 25% from that in 2012, and the total number of selected participants decreased by approximately 5% from that in 2012, then what would be the approximate percentage change in the number of participants not selected in 2013 with respect to 2012?
 x 100 =
  x 100 = 207.69 ≈ 208%
Directions: Study the following table carefully and answer the given question.
The number of participants who participated and got selected in a TV reality show screening, conducted in 5 different cities of Pakistan over the years is given below in the table:
Participants Participated (PAR) and Selected (SEL) Each Year

The percentage of participants selected from Multan was highest in which of the given years?
Important Questions for Test Level 2: Table
Test Level 2: Table MCQs with Answers
Online Tests for Test Level 2: Table
|
© EduRev
|
Education Revolution
|


|


