Test Level 3: Mixed Graphs - CAT MCQ
15 Questions MCQ Test - Test Level 3: Mixed Graphs

Directions: Study the information given below and answer the following question.
The pie charts show the expenditure of a company on salaries of part-time and full-time employees for the first 6 months and the table shows the ratio of revenues generated by part-time employees to that by full-time employees in six months. Profit/loss is calculated as difference between revenue and expenditure, where the only expenditure incurred is in the form of salaries, as the rest is 100% subsidised by the government.


Q. If in January, the company's total profit was Rs. 11,65,000, then what was the revenue generated by full-time employees in that month?
The pie charts show the expenditure of a company on salaries of part-time and full-time employees for the first 6 months and the table shows the ratio of revenues generated by part-time employees to that by full-time employees in six months. Profit/loss is calculated as difference between revenue and expenditure, where the only expenditure incurred is in the form of salaries, as the rest is 100% subsidised by the government.
Directions: Study the following information and answer the question
1000 members of the Automotive Component Manufacturers Association (ACMA) contributed to India's Rs. 4500 crore exports in 2012-13. Of these, top 7 exporters are listed below. These companies are the top 7 exporters for both the years, i.e. 2011-12 and 2012-13.

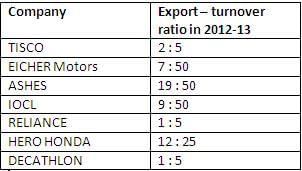
Q. What will be the approximate export growth by the top 7 companies from 2012-13 to 2013-14 if the total export increased by 20% from 2012-13 to 2013-14 considering there is no change in export for rest of the companies other than top 7 companies?
1000 members of the Automotive Component Manufacturers Association (ACMA) contributed to India's Rs. 4500 crore exports in 2012-13. Of these, top 7 exporters are listed below. These companies are the top 7 exporters for both the years, i.e. 2011-12 and 2012-13.

Directions: Study the following information and answer the question
1000 members of the Automotive Component Manufacturers Association (ACMA) contributed to India's Rs. 4500 crore exports in 2012-13. Of these, top 7 exporters are listed below. These companies are the top 7 exporters for both the years, i.e. 2011-12 and 2012-13.
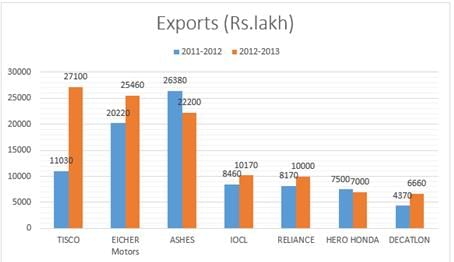

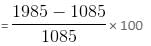
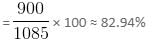
Q. If India's total auto exports increased by 12% from 2011-12 to 2012-13, then what was the approximate export growth by the companies which were not in the top 7 from 2011-12 to 2012-13?
1000 members of the Automotive Component Manufacturers Association (ACMA) contributed to India's Rs. 4500 crore exports in 2012-13. Of these, top 7 exporters are listed below. These companies are the top 7 exporters for both the years, i.e. 2011-12 and 2012-13.
Directions: Study the following information and answer the question.
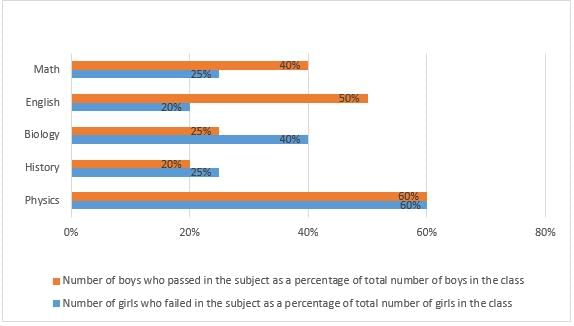
The bar graphs given below provide some information about the students of class X of a particular school. Five tests, one each on five different subjects - Physics, History, Biology, English and Maths, were conducted on a single day. 20% of the students were absent on that particular day and hence were not able to take the tests. All the present students took each of the five tests. As the school policy, the absent students were assumed to have failed in the tests.


Q. Find the ratio of the number of boys to the number of girls who passed in the History test.
Directions: Study the following information and answer the question.
The bar graphs given below provide some information about the students of class X of a particular school. Five tests, one each on five different subjects - Physics, History, Biology, English and Maths, were conducted on a single day. 20% of the students were absent on that particular day and hence were not able to take the tests. All the present students took each of the five tests. As the school policy, the absent students were assumed to have failed in the tests.
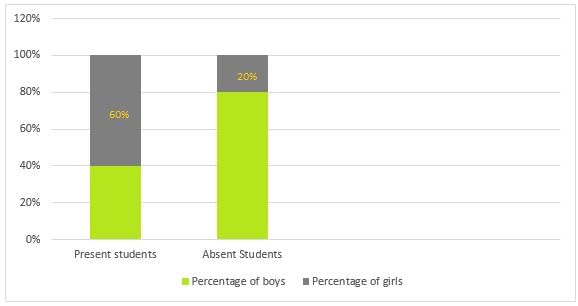
Q. Amongst the students who took the test, what is the ratio of the number of boys to the number of girls who failed in the Maths test?

Directions: Study the following information and answer the question.

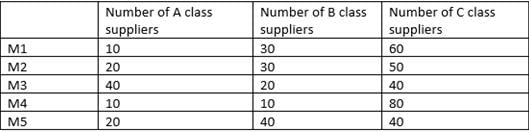
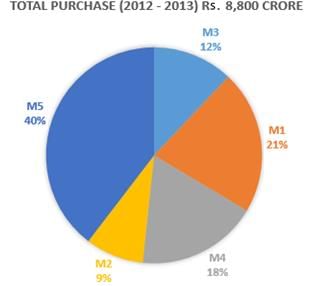
The pie-chart above gives the break-up of the total purchases across various categories for Tata Iron Pvt. Ltd. in the year 2012-13. The Tata Iron Pvt. Ltd. procures materials of five categories: M1, M2, M3, M4 and M5. Each material category has a supplier base of 100 suppliers (as given in the table) and there are no supplier overlaps across material categories. The supplier classification is as follows:
1. A class suppliers: They contribute to 70 per cent of the purchases of each metal category.
2. B class suppliers: They contribute to 20 per cent of the purchases of each metal category.
3. C class suppliers: They contribute to 10 per cent of the purchases of each metal category.
Q. What is the average value of purchases per supplier made by C class suppliers in M4?
Directions: Study the following information and answer the question.

The pie-chart above gives the break-up of the total purchases across various categories for Tata Iron Pvt. Ltd. in the year 2012-13. The Tata Iron Pvt. Ltd. procures materials of five categories: M1, M2, M3, M4 and M5. Each material category has a supplier base of 100 suppliers (as given in the table) and there are no supplier overlaps across material categories. The supplier classification is as follows:
1. A class suppliers: They contribute to 70 per cent of the purchases of each metal category.
2. B class suppliers: They contribute to 20 per cent of the purchases of each metal category.
3. C class suppliers: They contribute to 10 per cent of the purchases of each metal category.
Q. What is the difference between values of purchases made by A class supplier in M2 and B class suppliers in M4 material category?
Directions: Study the data given below and answer the following question.
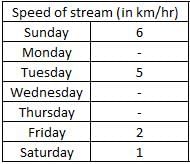
The pie charts below show the percentages of the total distance covered by a boat moving upstream and downstream on different days of a week. The table shows the speeds of the stream (in km/hr) on different days of the week.
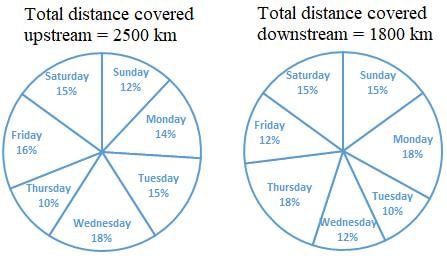
Q. Time taken on Monday while travelling upstream was 5 hours more than time taken on Wednesday while travelling downstream, and time taken on Monday while travelling downstream was  hours. If the speed of the boat in still water on Monday was 32 km/hr and the speed of the stream on Wednesday was 4 km/hr less than that on Monday, then calculate the speed of the boat in still water on Wednesday.
Directions: Study the data given below and answer the following question.
The pie charts below show the percentages of the total distance covered by a boat moving upstream and downstream on different days of a week. The table shows the speeds of the stream (in km/hr) on different days of the week.


Q. Calculate the time taken on Tuesday travelling upstream if the time taken on Friday travelling downstream was 3 hours more than the time taken on Tuesday travelling downstream, and speed of the boat in still water on Friday was 22 km/hr.
Directions: The table below shows the details of various items sold by a store.
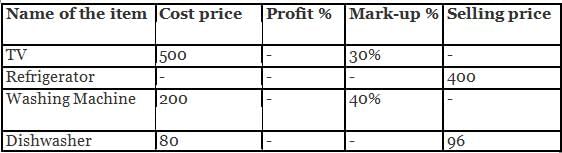
The pie chart shows the breakup of number of items in the store.

Q. If a shopkeeper earns 5% profit on Washing Machines and the ratio between the number of Refrigerators to the number of Washing Machines is 1 : 3, then how much total discount did the shopkeeper give on the sale of 3/4th of Washing Machines?
Directions: The table below shows the details of various items sold by a store.

The pie chart shows the breakup of number of items in the store.
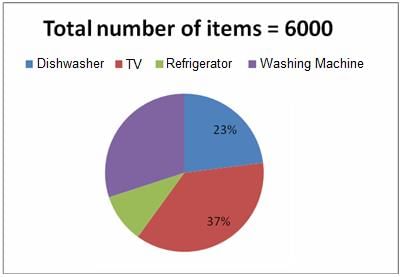
Q. If the shopkeeper allows 10% discount on the marked price of TV and the cost price of one Refrigerator is Rs. 385, then what is the difference between the profit earned on all the TVs and that on all the Refrigerators? It is given that the ratio of the number of Refrigerators to the number of Washing Machines is 1 : 3.
Directions: Study the following information and answer the question
1000 members of the Automotive Component Manufacturers Association (ACMA) contributed to India's Rs. 4500 crore exports in 2012-13. Of these, top 7 exporters are listed below. These companies are the top 7 exporters for both the years, i.e. 2011-12 and 2012-13.


Q. How many companies among the top 7 exporters have a turnover of more than Rs. 600 crore in 2012-13?
Directions: Study the following information and answer the question
1000 members of the Automotive Component Manufacturers Association (ACMA) contributed to India's Rs. 4500 crore exports in 2012-13. Of these, top 7 exporters are listed below. These companies are the top 7 exporters for both the years, i.e. 2011-12 and 2012-13.
Q. Which company recorded the fourth highest percentage growth in exports during 2012-13?
Directions: Study the following information and answer the question.
The bar graphs given below provide some information about the students of class X of a particular school. Five tests, one each on five different subjects - Physics, History, Biology, English and Maths, were conducted on a single day. 20% of the students were absent on that particular day and hence were not able to take the tests. All the present students took each of the five tests. As the school policy, the absent students were assumed to have failed in the tests.


Q. By what percent is the number of girls who passed in the History test more than the number of boys who failed in the English test?
Directions: Study the following information and answer the question.


The pie-chart above gives the break-up of the total purchases across various categories for Tata Iron Pvt. Ltd. in the year 2012-13. The Tata Iron Pvt. Ltd. procures materials of five categories: M1, M2, M3, M4 and M5. Each material category has a supplier base of 100 suppliers (as given in the table) and there are no supplier overlaps across material categories. The supplier classification is as follows:
1. A class suppliers: They contribute to 70 per cent of the purchases of each metal category.
2. B class suppliers: They contribute to 20 per cent of the purchases of each metal category.
3. C class suppliers: They contribute to 10 per cent of the purchases of each metal category.
Q. In 2013-14, the value of purchases is expected to grow at 12% and the supplier base is expected to grow at 20%. What will be the likely average value of purchases per supplier in 2013-14?
Important Questions for Test Level 3: Mixed Graphs
Test Level 3: Mixed Graphs MCQs with Answers
Online Tests for Test Level 3: Mixed Graphs
|
© EduRev
|
Education Revolution
|


|


within 7 days!