CAT Exam  >  CAT Tests  >  Level-wise Tests for CAT  >  Test Level 3: Venn Diagrams - CAT MCQ

Test Level 3: Venn Diagrams - CAT MCQ


Test Description

10 Questions MCQ Test Level-wise Tests for CAT - Test Level 3: Venn Diagrams

Test Level 3: Venn Diagrams for CAT 2024 is part of Level-wise Tests for CAT preparation. The Test Level 3: Venn Diagrams questions and answers have been prepared according to the CAT exam syllabus.The Test Level 3: Venn Diagrams MCQs are made for CAT 2024 Exam. Find important definitions, questions, notes, meanings, examples, exercises, MCQs and online tests for Test Level 3: Venn Diagrams below.
Solutions of Test Level 3: Venn Diagrams questions in English are available as part of our Level-wise Tests for CAT for CAT & Test Level 3: Venn Diagrams solutions in Hindi for Level-wise Tests for CAT course. Download more important topics, notes, lectures and mock test series for CAT Exam by signing up for free. Attempt Test Level 3: Venn Diagrams | 10 questions in 20 minutes | Mock test for CAT preparation | Free important questions MCQ to study Level-wise Tests for CAT for CAT Exam | Download free PDF with solutions
Test Level 3: Venn Diagrams - Question 1

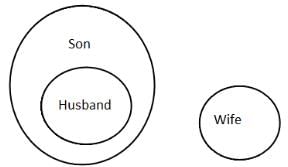
Directions: From the alternatives, choose the diagram that best represents the relationship among the given classes.
Husband, Wife, Son

Detailed Solution for Test Level 3: Venn Diagrams - Question 1

Every husband is a son of someone, and these two are totally different from wives.

Test Level 3: Venn Diagrams - Question 2

Directions: Study the diagram given below and answer the following question.
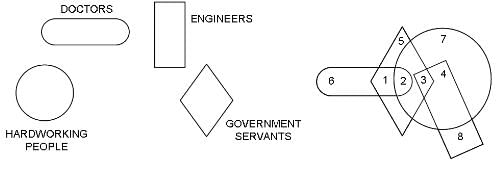
If there are 600 doctors, then how many engineers are there?

Detailed Solution for Test Level 3: Venn Diagrams - Question 2

It cannot be determined because we only have the number of doctors.

1 Crore+ students have signed up on EduRev. Have you? Download the App
Test Level 3: Venn Diagrams - Question 3

Directions: Study the diagram given below and answer the following question.

The engineers who keep themselves away from hard work are represented by

Detailed Solution for Test Level 3: Venn Diagrams - Question 3

The number '8' represents the people who are engineers and not hardworking as '8' is outside the circle but inside the rectangle.

Test Level 3: Venn Diagrams - Question 4

Directions: Study the diagram given below and answer the following question.
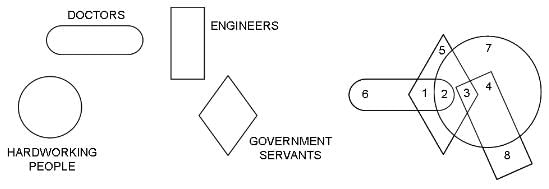
Which of the following statements is correct?

Detailed Solution for Test Level 3: Venn Diagrams - Question 4

5 represents government servants which are not doctors, hardworking people, or engineers.

Test Level 3: Venn Diagrams - Question 5

Directions: From the alternatives, choose the diagram that best represents the relationship among the given classes.
Jupiter, Earth, Sun

Detailed Solution for Test Level 3: Venn Diagrams - Question 5

Jupiter, Earth and Sun are three different bodies.
Hence, option 2 is correct.

Test Level 3: Venn Diagrams - Question 6

Directions: Study the diagram given below carefully and answer the following question.  
I – Males
II – Indians
III – Sportsperson 
IV – Educated
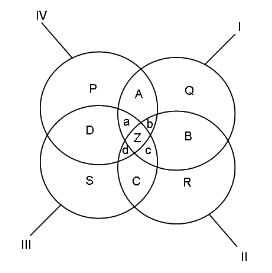
The female Indian swimmers who participated in the World University Games may be represented by which of the following sections of the given Venn diagram? 

Detailed Solution for Test Level 3: Venn Diagrams - Question 6

Indian females who participated in the World University Games were educated players and hence would be represented by section d.

Test Level 3: Venn Diagrams - Question 7

Directions: Study the diagram given below carefully and answer the following question.
I – Males
II – Indians
III – Sportsmen
IV – Educated
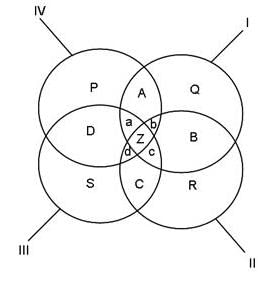
An educated male Indian sportsman will take his place in which of the following sections of this diagram?

Detailed Solution for Test Level 3: Venn Diagrams - Question 7

Since, I – Males, II – Indians, III – Sportsmen, IV – Educated, an educated male Indian sportsman should fall in the region common to all the above.
So, Z is the appropriate category for him.

Test Level 3: Venn Diagrams - Question 8

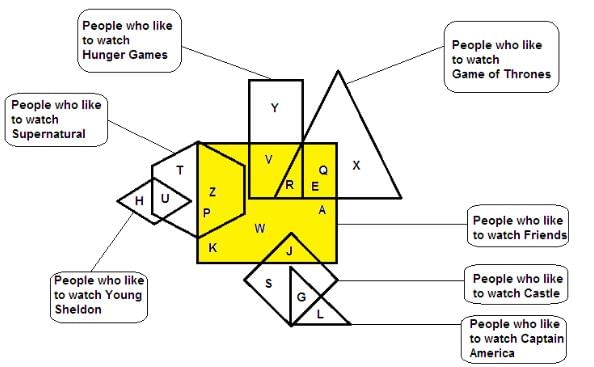
Directions: Study the diagram given below and answer the following question.
Here, the letters represent people.
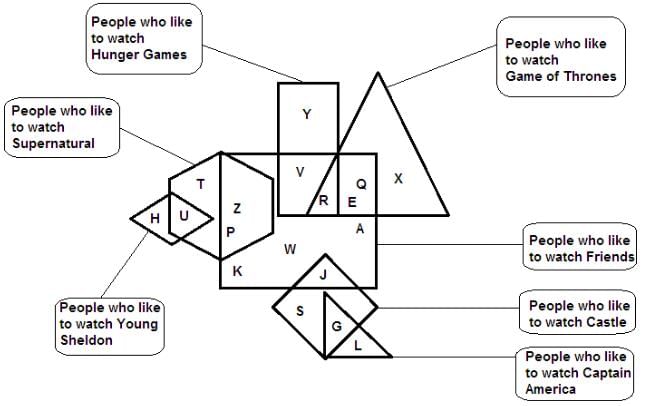
How many people like to watch Friends?

Detailed Solution for Test Level 3: Venn Diagrams - Question 8


We can see that V, R, E, Q, A, Z, P, K, J and W, i.e. 10 of them, lie inside the big square, which contains people who like to watch Friends.
So, there are 10 people who like to watch Friends.

Test Level 3: Venn Diagrams - Question 9

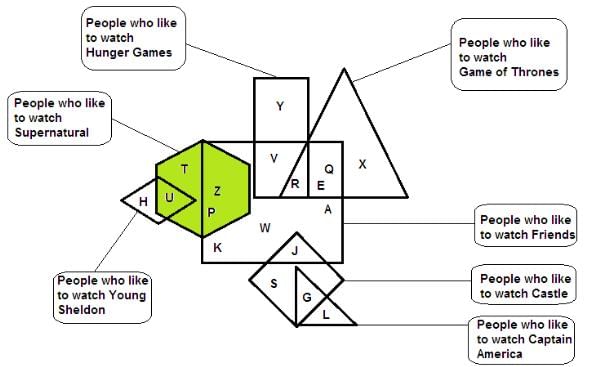
Directions: Study the diagram given below and answer the following question.
Here, the letters represent people.
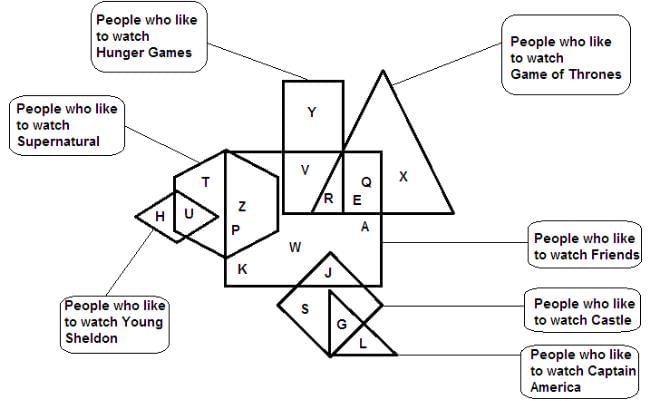
Other than Z and P, who else like to watch Supernatural?

Detailed Solution for Test Level 3: Venn Diagrams - Question 9


According to the diagram, other than Z and P, T and U also like to watch Supernatural.

Test Level 3: Venn Diagrams - Question 10

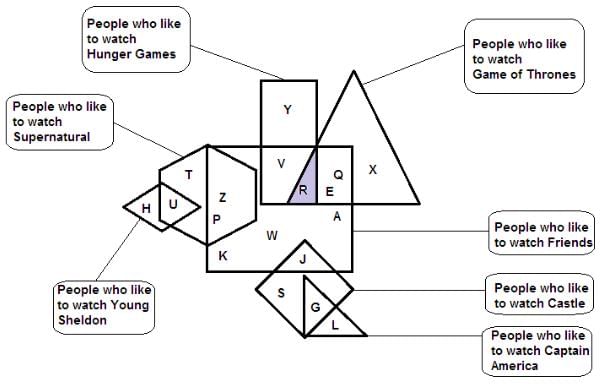
Directions: Study the diagram given below and answer the following question.
Here, the letters represent people.
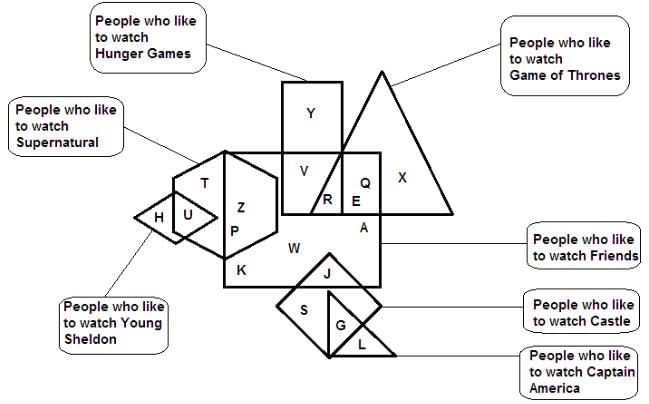
Which of the following statements is true regarding R?

Detailed Solution for Test Level 3: Venn Diagrams - Question 10


According to the diagram, R does not like to watch Supernatural. Hence, option 3 is the answer.

5 docs|272 tests
Information about Test Level 3: Venn Diagrams Page
In this test you can find the Exam questions for Test Level 3: Venn Diagrams solved & explained in the simplest way possible. Besides giving Questions and answers for Test Level 3: Venn Diagrams, EduRev gives you an ample number of Online tests for practice

Top Courses for CAT

Download as PDF

Top Courses for CAT