SSC CGL Exam  >  SSC CGL Tests  >  Quantitative Aptitude for SSC CGL  >  Test: Pie Charts - 2 - SSC CGL MCQ

Test: Pie Charts - 2 - SSC CGL MCQ


Test Description

15 Questions MCQ Test Quantitative Aptitude for SSC CGL - Test: Pie Charts - 2

Test: Pie Charts - 2 for SSC CGL 2025 is part of Quantitative Aptitude for SSC CGL preparation. The Test: Pie Charts - 2 questions and answers have been prepared according to the SSC CGL exam syllabus.The Test: Pie Charts - 2 MCQs are made for SSC CGL 2025 Exam. Find important definitions, questions, notes, meanings, examples, exercises, MCQs and online tests for Test: Pie Charts - 2 below.
Solutions of Test: Pie Charts - 2 questions in English are available as part of our Quantitative Aptitude for SSC CGL for SSC CGL & Test: Pie Charts - 2 solutions in Hindi for Quantitative Aptitude for SSC CGL course. Download more important topics, notes, lectures and mock test series for SSC CGL Exam by signing up for free. Attempt Test: Pie Charts - 2 | 15 questions in 15 minutes | Mock test for SSC CGL preparation | Free important questions MCQ to study Quantitative Aptitude for SSC CGL for SSC CGL Exam | Download free PDF with solutions
Test: Pie Charts - 2 - Question 1

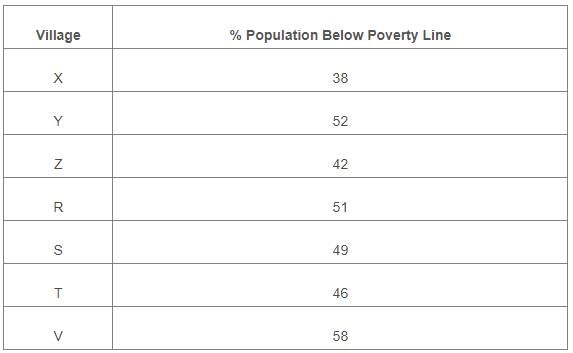
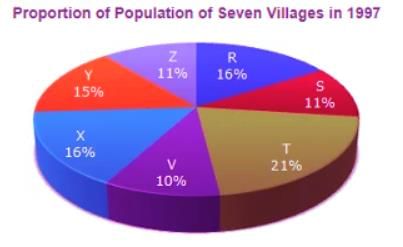
Study the following pie-chart and the table and answer the questions based on them.
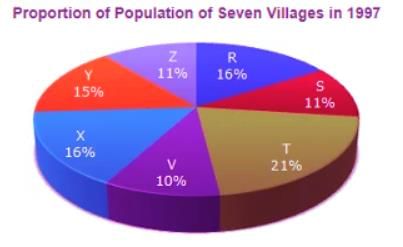
Q. If in 1999, the population of village R increase by 10% while that of village Z reduces by 5% compared to that in 1997 and the percentage of population below poverty line remains unchanged for all the villages, then find the approximate ratio of population of village R below poverty line to the ratio of population of village Z below poverty line for the year 1999.

Detailed Solution for Test: Pie Charts - 2 - Question 1

Let the total population of all the seven village in 1997 be N.
Then, population of village R in 1997
= 16% of N = 16N/100
and population of village Z in 1997
= 11% of N = 11N/100
Population of village R in 1999 
= { 16N/100 + (10% of 16N/100) }
= 1760N/10000
and population of village Z in 1999
= { 11N/100 - (5% of 11N/100)}
= 1045N/10000
Now, population of village R below poverty line for 1999
= 51% of 1760N/10000 
and population of village Z below poverty line for 1999
= 42% of  1045N/10000 
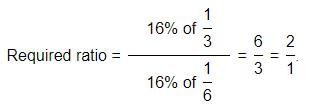
= 51% of (1760N/10000) / 42% of (1045N/10000)

= 2/1

Test: Pie Charts - 2 - Question 2

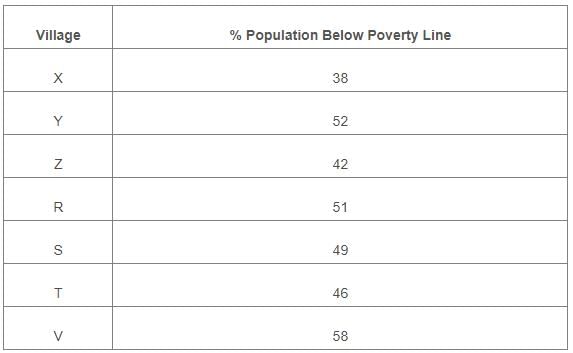
Study the following pie-chart and the table and answer the questions based on them.
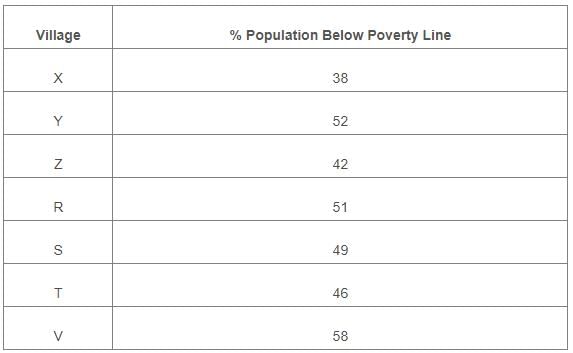
Q. If in 1998, the population of village Y and V increase by 10% each and the percentage of population below poverty line remains unchanged for all the villages, then find the population of village V below poverty line in 1998, given that the population of village Y in 1997 was 30000.

Detailed Solution for Test: Pie Charts - 2 - Question 2

Population of village Y in 1997 = 30000 (given).

Let the population of village V in 1997 be v.

Then, 15 : 10 = 30000 : v   =>  

15
= 20000.

Now, population of village V in 1998 

= 20000 + (10% of 20000) = 22000.

Therefore Population of village V below poverty line in 1998 

= 58% of 22000 = 12760.

Test: Pie Charts - 2 - Question 3

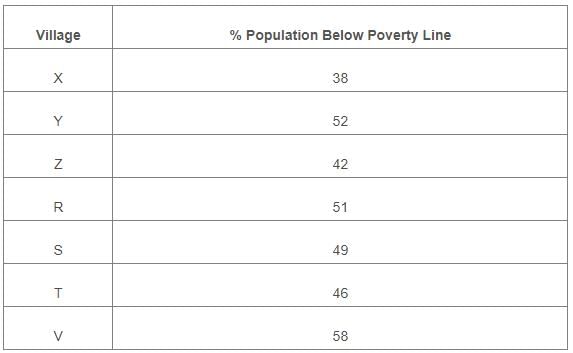
Study the following pie-chart and the table and answer the questions based on them.
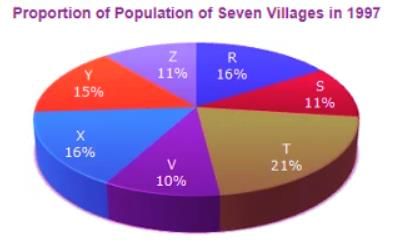
Q. If the population of village R in 1997 is 32000, then what will be the population of village Y below poverty line in that year?

Detailed Solution for Test: Pie Charts - 2 - Question 3

Population of village R = 32000 (given).

Let the population of village Y be y.

Then, 16 : 15 = 32000 : y 
= 30000.

∴ Population of village Y below poverty line 

= 52% of 30000 = 15600

Test: Pie Charts - 2 - Question 4

Study the following pie-chart and the table and answer the questions based on them.
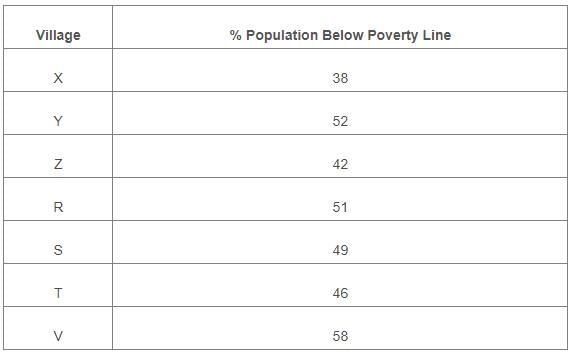
Q. The ratio of population of village T below poverty line to that of village Z below poverty line in 1997 is:

Detailed Solution for Test: Pie Charts - 2 - Question 4

Let N be the total population of all the seven villages.

Then, population of village T below poverty line 

= 46% of (21% of N)

and Population of villages Z below the poverty line

 = 42% of (11% of N)

= 23/11.

Test: Pie Charts - 2 - Question 5

Study the following pie-chart and the table and answer the questions based on them.
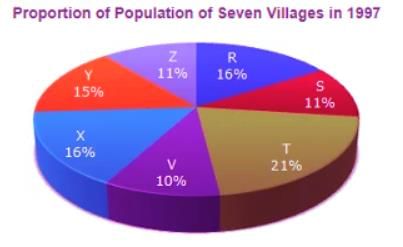
Q. Find the population of village S if the population of village X below poverty line in 1997 is 12160.

Detailed Solution for Test: Pie Charts - 2 - Question 5

Let the population of village X be x.

Then, 38% of x = 12160 
= 32000.
Now, if s be the population of village S, then
16 : 11 = 32000 : s ⇒ s =

Test: Pie Charts - 2 - Question 6

Study the following graph carefully and answer the questions given below:
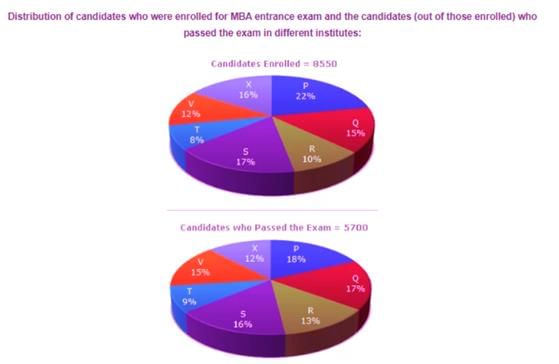
Q. The number of candidates passed from institute S and P together exceeds the number of candidates enrolled from institute T and R together by:

Detailed Solution for Test: Pie Charts - 2 - Question 6

Required difference:

= [(16% + 18%) of 5700] - [(8% + 10%) of 8550

= [(34% of 5700) - (18% of 8550)]

= (1938 - 1539)

= 399

Test: Pie Charts - 2 - Question 7

Study the following graph carefully and answer the questions given below:
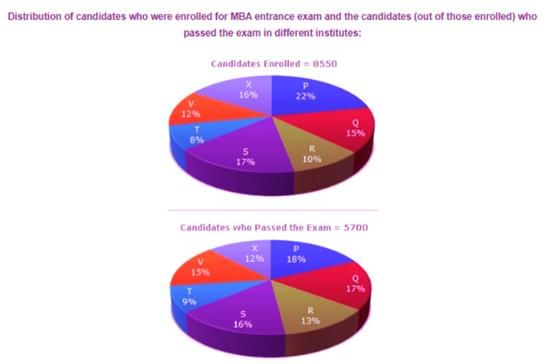
Q. What is the percentage of candidates passed to the candidates enrolled for institutes Q and R together?

Detailed Solution for Test: Pie Charts - 2 - Question 7

Candidates passed from institutes Q and R together
= [(13% + 17%) of 5700]
= 30% of 5700.
Candidates enrolled from institute Q and R together
= [(15% + 10%) of 8550]
= 25% of 8550.
Required Percentage    


= 80%

Test: Pie Charts - 2 - Question 8

Study the following graph carefully and answer the questions given below:
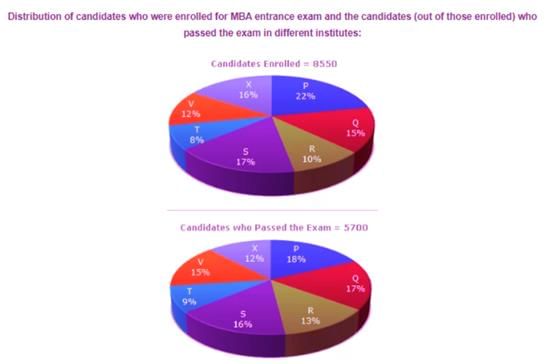
Q. Which institute has the highest percentage of candidates passed to the candidates enrolled?

Detailed Solution for Test: Pie Charts - 2 - Question 8

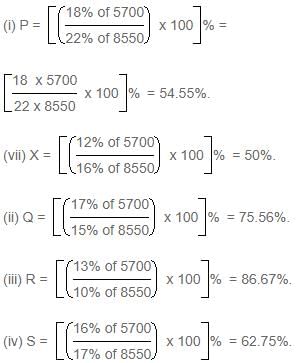
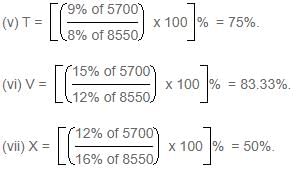
The percentage of candidates passed to candidates enrolled can be determined for each institute as under:


Highest of these is 86.67% corresponding to institute R.

Test: Pie Charts - 2 - Question 9

Study the following graph carefully and answer the questions given below:
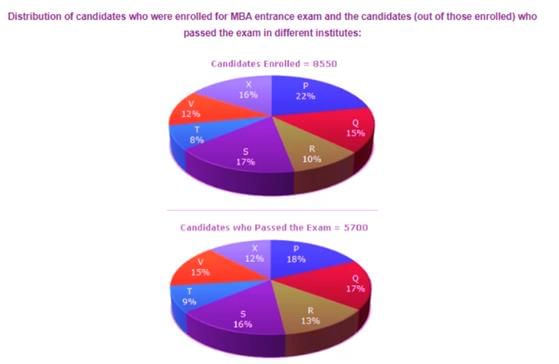
Q. What is the ratio of candidates passed to the candidates enrolled from institute P?

Detailed Solution for Test: Pie Charts - 2 - Question 9

Required ratio = 

Test: Pie Charts - 2 - Question 10

Study the following graph carefully and answer the questions given below:
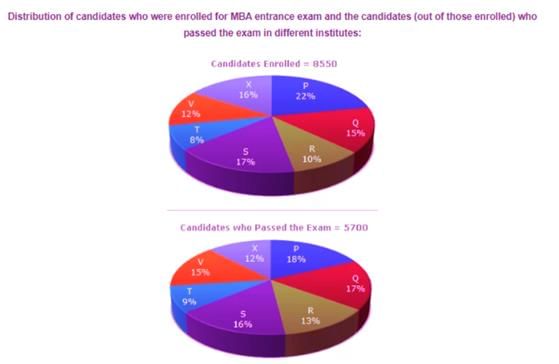
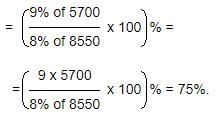
Q. What percentage of candidates passed the Exam from institute T out of the total number of candidates enrolled from the same institute?

Detailed Solution for Test: Pie Charts - 2 - Question 10

Required percentage

Test: Pie Charts - 2 - Question 11

Study the following pie-diagrams carefully and answer the questions given below it:
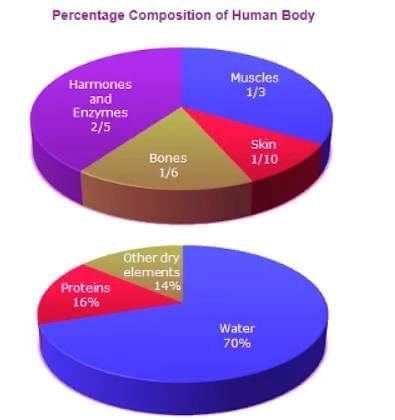
Q. To show the distribution of proteins and other dry elements in the human body, the arc of the circle should subtend at the centre an angle of:

Detailed Solution for Test: Pie Charts - 2 - Question 11

Percentage of proteins and other dry elements in the body

=(16% + 14%)

= 30%

Central angle corresponding to proteins and other dry elements together

= 30% of 360º

= 108º.

Test: Pie Charts - 2 - Question 12

Study the following pie-diagrams carefully and answer the questions given below it:
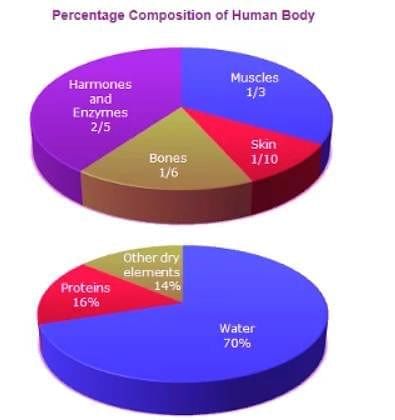
Q. What percent of the total weight of human body is equivalent to the weight of the proteins in skin in human body?

Detailed Solution for Test: Pie Charts - 2 - Question 12

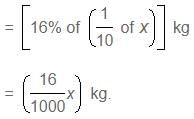
Let the body weight be x kg.

Then, weight of skin protein in the body

Test: Pie Charts - 2 - Question 13

Study the following pie-diagrams carefully and answer the questions given below it:
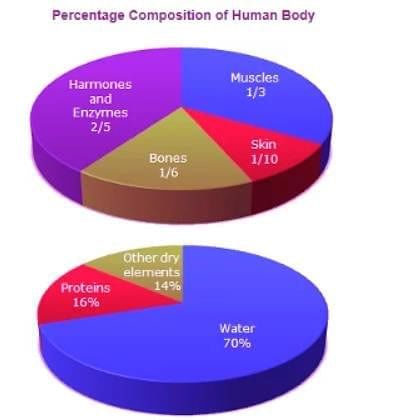
Q. What will be the quantity of water in the body of a person weighing 50 kg?

Detailed Solution for Test: Pie Charts - 2 - Question 13

Quantity of water in the body of a person weighing 50 kg

= (70% of 50)

= 35 kg

Test: Pie Charts - 2 - Question 14

Study the following pie-diagrams carefully and answer the questions given below it:
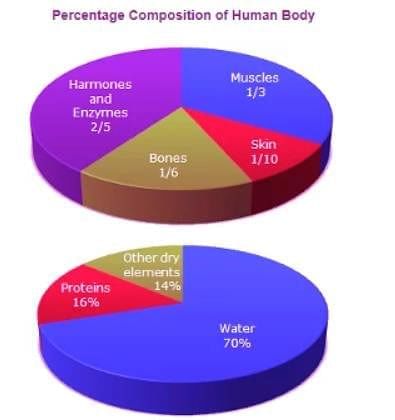
Q. What is the ratio of the distribution of proteins in the muscles to that of the distribution of proteins in the bones?

Detailed Solution for Test: Pie Charts - 2 - Question 14

Test: Pie Charts - 2 - Question 15

Study the following pie-diagrams carefully and answer the questions given below it:
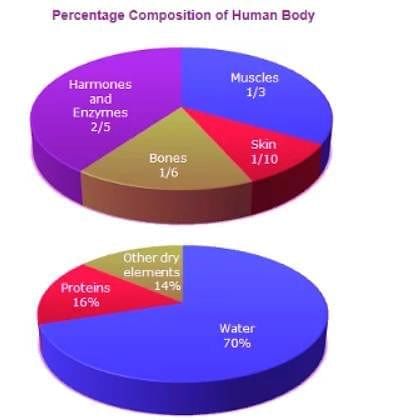
Q. In the human body, what part is made of neither bones nor skin?

Detailed Solution for Test: Pie Charts - 2 - Question 15

Part of the body made of neither bones nor skin
= 1 - (1 + 1) = 11.61015

314 videos|170 docs|185 tests
Information about Test: Pie Charts - 2 Page
In this test you can find the Exam questions for Test: Pie Charts - 2 solved & explained in the simplest way possible. Besides giving Questions and answers for Test: Pie Charts - 2, EduRev gives you an ample number of Online tests for practice
314 videos|170 docs|185 tests
Download as PDF