Test: Quantitative Aptitude - 5 - Bank Exams MCQ
20 Questions MCQ Test RBI Grade B Mock Test Series & Past Year Papers 2025 - Test: Quantitative Aptitude - 5
Directions: Study the following information carefully and answer the questions given below.
There are four different restaurants A, B, C and D and each restaurant has two different items i.e. pizza and burger. The total number of items (burger and pizza) in C is 20% more than the number of items in B. The number of pizzas in B is 20% more than the number of pizzas in D. Ratio of the number of pizzas in B to C is 3:4. If 40% of items in B are burgers and 50% of items in A are pizzas. Total number of items in D is 1800 and the number of pizzas in C is 2400. The total number of items in B is 25% more than that of A.
Q. Number of pizzas in D is what percent more than the number of burgers in C?
Directions: Study the following information carefully and answer the questions given below.
There are four different restaurants A, B, C and D and each restaurant has two different items i.e. pizza and burger. The total number of items (burger and pizza) in C is 20% more than the number of items in B. The number of pizzas in B is 20% more than the number of pizzas in D. Ratio of the number of pizzas in B to C is 3:4. If 40% of items in B are burgers and 50% of items in A are pizzas. Total number of items in D is 1800 and the number of pizzas in C is 2400. The total number of items in B is 25% more than that of A.
Q. What is the difference between the total number of items in A and the number of pizzas in C?
Directions: Study the following information carefully and answer the questions given below.
There are four different restaurants A, B, C and D and each restaurant has two different items i.e. pizza and burger. The total number of items (burger and pizza) in C is 20% more than the number of items in B. The number of pizzas in B is 20% more than the number of pizzas in D. Ratio of the number of pizzas in B to C is 3:4. If 40% of items in B are burgers and 50% of items in A are pizzas. Total number of items in D is 1800 and the number of pizzas in C is 2400. The total number of items in B is 25% more than that of A.
Q. The total number of items in E is 50% more than that of D and the number of pizzas in E is 25% less than the number of pizzas in C. Find the number of burgers in E?
Directions: Study the following information carefully and answer the questions given below.
There are four different restaurants A, B, C and D and each restaurant has two different items i.e. pizza and burger. The total number of items (burger and pizza) in C is 20% more than the number of items in B. The number of pizzas in B is 20% more than the number of pizzas in D. Ratio of the number of pizzas in B to C is 3:4. If 40% of items in B are burgers and 50% of items in A are pizzas. Total number of items in D is 1800 and the number of pizzas in C is 2400. The total number of items in B is 25% more than that of A.
Q. Find the average of the number of items in A, B, C and D together?
Directions: Study the following information carefully and answer the questions given below.
There are four different restaurants A, B, C and D and each restaurant has two different items i.e. pizza and burger. The total number of items (burger and pizza) in C is 20% more than the number of items in B. The number of pizzas in B is 20% more than the number of pizzas in D. Ratio of the number of pizzas in B to C is 3:4. If 40% of items in B are burgers and 50% of items in A are pizzas. Total number of items in D is 1800 and the number of pizzas in C is 2400. The total number of items in B is 25% more than that of A.
The selling price of each burger and pizza in C is Rs.20 and Rs.25 respectively. Find the total revenue collected from C?
Directions: Study the following information carefully and answer the questions given below.
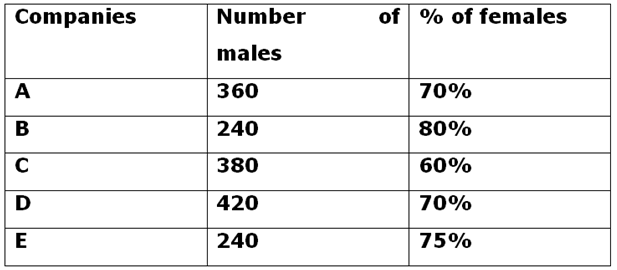
The given table shows the number of male employees and the percentage of female employees in five different companies

Q. The total number of employees in D is what percent more than the total number of employees in A?
Directions: Study the following information carefully and answer the questions given below.
The given table shows the number of male employees and the percentage of female employees in five different companies

Q. The number of male employees in F is 50% more than the number of male employees in C and the number of female employees in F is 20% more than the number of female employees in E. The total numbers of employee in E is approximately what percent of the total number of employees in F?
Directions: Study the following information carefully and answer the questions given below.
The given table shows the number of male employees and the percentage of female employees in five different companies

The total number of employees in D is half of the total number of employees in F. If the ratio of the number of male and female employees in F is 4:3, then find the difference between the number of female employees in B and F?
Directions: Study the following information carefully and answer the questions given below.
The given table shows the number of male employees and the percentage of female employees in five different companies

Q. What is the average number of female employees in B and D?
Directions: Study the following information carefully and answer the questions given below.
The given table shows the number of male employees and the percentage of female employees in five different companies

Q. What is the ratio of the number of female employees in A to the number of female employees in C?
Find out the wrong number in the following number series.
2, 4, 12, 24, 36, 144
Find out the wrong number in the following number series.
320, 323, 330, 338, 350, 365
Find out the wrong number in the following number series.
22, 161, 272, 357, 418, 456
Find out the wrong number in the following number series.
167, 118, 76, 42, 14, 4
Find out the wrong number in the following number series.
34, 45, 23, 56, 100, 67
Directions: Read the following information carefully and answer the questions.
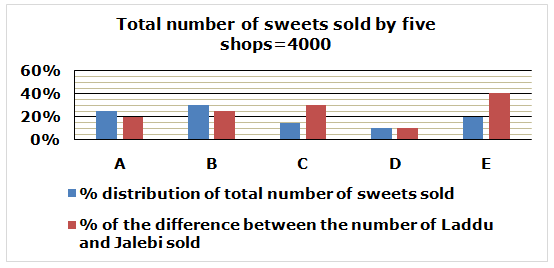
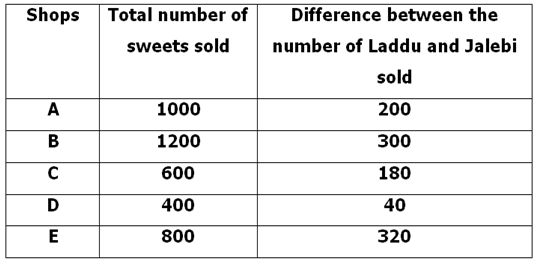
The given bar graph shows the percentage distribution of total number of sweets (Laddu and Jalebi) sold by five different shops i.e. A, B, C, D and E and also given the percentage of the difference between the number of Laddu and Jalebi sold by five different shops.

Q. If the ratio of the number of Laddu and Jalebi sold by shop B is 3:5 respectively and the average number of Laddu sold by shops B and D together is 335, then find the number of Jalebi sold by shop D?
Directions: Read the following information carefully and answer the questions.
The given bar graph shows the percentage distribution of total number of sweets (Laddu and Jalebi) sold by five different shops i.e. A, B, C, D and E and also given the percentage of the difference between the number of Laddu and Jalebi sold by five different shops.

Q. If the total number of sweets sold by shop F is 25% more than that of shop D and the number of Laddu sold by shop F is 140 more than that of Jalebi, then find the ratio of the number of Laddu and Jalebi sold by shop F?
Directions: Read the following information carefully and answer the questions.
The given bar graph shows the percentage distribution of total number of sweets (Laddu and Jalebi) sold by five different shops i.e. A, B, C, D and E and also given the percentage of the difference between the number of Laddu and Jalebi sold by five different shops.

Q. Number of Jalebi sold by shop E is less than that of Laddu and the selling price of each Laddu is Rs.5. If all the sweets are sold by shop E for Rs.4720, then find the selling price of each Jalebi?
Directions: Read the following information carefully and answer the questions.
The given bar graph shows the percentage distribution of total number of sweets (Laddu and Jalebi) sold by five different shops i.e. A, B, C, D and E and also given the percentage of the difference between the number of Laddu and Jalebi sold by five different shops.

Q. If the number of Laddu sold by shop A is more than that of Jalebi, then the number of Jalebi sold by shop A is what percentage of total number of sweets sold by shop E?
Directions: Read the following information carefully and answer the questions.
The given bar graph shows the percentage distribution of total number of sweets (Laddu and Jalebi) sold by five different shops i.e. A, B, C, D and E and also given the percentage of the difference between the number of Laddu and Jalebi sold by five different shops.

Q. Total number of sweets sold by shop B is how much more/less than the total number of sweets sold by shops C and E together?
|
114 docs|51 tests
|


