UPSC Exam  >  UPSC Tests  >  CSAT Preparation  >  Test: Statistics - 1 - UPSC MCQ

Test: Statistics - 1 - UPSC MCQ


Test Description

20 Questions MCQ Test CSAT Preparation - Test: Statistics - 1

Test: Statistics - 1 for UPSC 2024 is part of CSAT Preparation preparation. The Test: Statistics - 1 questions and answers have been prepared according to the UPSC exam syllabus.The Test: Statistics - 1 MCQs are made for UPSC 2024 Exam. Find important definitions, questions, notes, meanings, examples, exercises, MCQs and online tests for Test: Statistics - 1 below.
Solutions of Test: Statistics - 1 questions in English are available as part of our CSAT Preparation for UPSC & Test: Statistics - 1 solutions in Hindi for CSAT Preparation course. Download more important topics, notes, lectures and mock test series for UPSC Exam by signing up for free. Attempt Test: Statistics - 1 | 20 questions in 20 minutes | Mock test for UPSC preparation | Free important questions MCQ to study CSAT Preparation for UPSC Exam | Download free PDF with solutions
Test: Statistics - 1 - Question 1

The extreme values in negatively skewed distribution lie in the_____.

Detailed Solution for Test: Statistics - 1 - Question 1

In a negatively skewed distribution, also known as a left-skewed distribution, the tail of the distribution extends towards the left side, while the bulk of the data is concentrated towards the right side. This means that the values on the left side are more spread out and can potentially have extreme values.

To understand this, let's consider an example. Imagine a dataset representing the incomes of a group of individuals. If the distribution is negatively skewed, it means that most individuals have relatively higher incomes, and only a few individuals have lower incomes. The majority of the data points will be clustered towards the higher income values, creating a longer tail towards the lower income values.

Therefore, the extreme or outlier values, which are typically the lowest values in a negatively skewed distribution, will be found in the left tail of the distribution. These extreme values can significantly influence the mean and can pull it towards the left, resulting in a lower mean compared to the median.

In summary, the extreme values in a negatively skewed distribution are located in the left tail.

Test: Statistics - 1 - Question 2

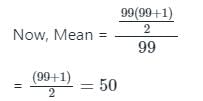
What is the mean of first 99 natural numbers?

Detailed Solution for Test: Statistics - 1 - Question 2

Suppose there are ‘n’ observations {x1, x2, x3,…, xn}

Calculation:

To find:  Mean of the first 99 natural numbers

As we know, Sum of first n natural numbers = 

1 Crore+ students have signed up on EduRev. Have you? Download the App
Test: Statistics - 1 - Question 3

Sum of square of the deviations about mean is_______.

Detailed Solution for Test: Statistics - 1 - Question 3

The sum of the squares of the deviations about the mean is also known as the sum of squared deviations or sum of squares. It is a measure of the dispersion or variability in a dataset.

To calculate the sum of squares, we first calculate the deviation of each data point from the mean by subtracting the mean from each data point. Then, we square each deviation and sum up all the squared deviations.

When we calculate the sum of squares, the goal is to minimize this value. By minimizing the sum of squares, we can find the best-fitting measure of central tendency, which is the mean. This is the idea behind the method of least squares, which is commonly used in regression analysis to find the best-fit line.

If we were to change any of the data points slightly, the sum of squares would increase. Therefore, the current sum of squares represents the minimum value of the sum of squares possible for that dataset.

In summary, the sum of the squares of the deviations about the mean is minimum for a given dataset.

Test: Statistics - 1 - Question 4

Let the average of three numbers be 16. If two of the numbers are 8 and 10, what is the remaining number?

Detailed Solution for Test: Statistics - 1 - Question 4

Concept:

Calculation:

Here n = 3. Let's say that the third number is x.

⇒ x + 18 = 48

⇒ x = 30.

Test: Statistics - 1 - Question 5

Which mean is most affected by extreme values?

Detailed Solution for Test: Statistics - 1 - Question 5

The arithmetic mean is the most commonly used measure of central tendency. It is calculated by summing all the values in a dataset and dividing it by the total number of values. The arithmetic mean is sensitive to extreme values because it takes into account the magnitude of each data point.

When there are extreme values in a dataset, they can significantly affect the arithmetic mean. Extreme values have a disproportionate impact on the sum of the values used in the calculation, pulling the mean towards them.

For example, let's consider a dataset representing the incomes of a group of individuals. If there is an outlier with an extremely high income, the arithmetic mean will be greatly influenced by this value. The presence of the extreme value can inflate the arithmetic mean, making it higher than the typical income for the majority of individuals in the dataset.

To address the issue of extreme values affecting the arithmetic mean, alternative measures like trimmed mean or winsorized mean can be used. These methods involve removing or downweighting a certain percentage of extreme values before calculating the mean. This helps mitigate the impact of outliers on the resulting value.

In summary, the arithmetic mean is the measure of central tendency that is most affected by extreme values in a dataset.

Test: Statistics - 1 - Question 6

The appropriate average for calculating average percentage increase in population is____________.

Detailed Solution for Test: Statistics - 1 - Question 6

When calculating the average percentage increase, it is important to consider the compounding nature of the changes. The geometric mean is well-suited for this purpose because it captures the growth rate over multiple periods.

The geometric mean is calculated by taking the nth root of the product of n values. In the context of calculating the average percentage increase in population, we would take the geometric mean of the growth rates observed over a specific period.

For example, let's consider a population that experienced the following percentage changes over five years: +10%, +5%, -3%, +8%, and +12%. To calculate the average percentage increase over these five years, we would take the geometric mean of these growth rates.

Using the arithmetic mean would not be appropriate in this case because it does not account for the compounding effect of the growth rates. The arithmetic mean would treat each growth rate equally, regardless of the compounding nature.

The geometric mean, on the other hand, considers the relative changes in the population size and provides an average growth rate that reflects the compounding effect over time. It is particularly useful when analyzing growth rates, financial returns, or any situation involving multiplicative changes.

In summary, the appropriate average for calculating the average percentage increase in population is the geometric mean.

Test: Statistics - 1 - Question 7

Statistics are aggregates of______________

Detailed Solution for Test: Statistics - 1 - Question 7

Statistics is a branch of mathematics that deals with the collection, analysis, interpretation, presentation, and organization of data. Data is the raw information or facts that are collected from various sources, such as surveys, experiments, observations, or databases.

Statistics take this raw data and transform it into meaningful information by applying various methods and calculations. These methods and calculations include techniques for summarizing and describing data, making inferences or predictions, testing hypotheses, and drawing conclusions.

While methods and calculations are used in the field of statistics, they are tools or techniques employed to analyze and process the data. They are not the aggregates themselves. Similarly, facts are individual pieces of information, whereas statistics involve the systematic and structured analysis of data to draw broader conclusions or make generalizations.

Therefore, statistics are aggregates of data. Data forms the foundation of statistical analysis, and statistics provide insights, summaries, and interpretations of the data, enabling us to better understand and draw conclusions about the phenomena or populations being studied.

Test: Statistics - 1 - Question 8

If the mode of the following data is 7, then the value of k in the data set 3, 8, 6, 7, 1, 6, 10, 6, 7, 2k + 5, 9, 7, and 13 is:

Detailed Solution for Test: Statistics - 1 - Question 8

Concept:

Mode is the value that occurs most often in the data set of values.

Calculation:

Given data values are 3, 8, 6, 7, 1, 6, 10, 6, 7, 2k + 5, 9, 7, and 13

In the above data set, values 6, and 7 have occurred more times i.e., 3 times

But given that mode is 7.

So, 7 should occur more times than 6.

Hence the variable 2k + 5 must be 7

⇒ 2k + 5 = 7

⇒ 2k = 2

∴ k = 1

Test: Statistics - 1 - Question 9

The measures of dispersion are changed by the change of__________.

Detailed Solution for Test: Statistics - 1 - Question 9

Measures of dispersion are statistical indicators that quantify the spread or variability of a dataset. They provide information about how the values in a dataset are dispersed or scattered around a central value, such as the mean or median.

When we talk about changing the scale, we refer to altering the magnitude or size of the values in the dataset. This can be achieved by multiplying or dividing the values by a constant factor.

When the scale of the data changes, the measures of dispersion will also change. Let's consider some common measures of dispersion:

  1. Range: The range is the simplest measure of dispersion and is calculated as the difference between the maximum and minimum values in a dataset. Changing the scale by multiplying or dividing the data will directly affect the range since it depends on the magnitude of the values.

  2. Variance and Standard Deviation: These measures quantify the average deviation of data points from the mean. Changing the scale will affect both the variance and the standard deviation because they involve squaring the differences between each data point and the mean.

  3. Interquartile Range (IQR): The IQR is a measure of dispersion that represents the range between the 25th and 75th percentiles of the dataset. Changing the scale will impact the IQR since it is calculated based on percentiles.

In all these cases, changing the scale of the data will result in corresponding changes in the measures of dispersion. The scale affects the absolute values and the spread of the data points, leading to different values for the measures of dispersion.

Therefore, the measures of dispersion are changed by the change of scale.

Test: Statistics - 1 - Question 10

If mean and mode of some data are 4 & 10 respectively, its median will be:

Detailed Solution for Test: Statistics - 1 - Question 10

Concept:

Mean: The mean or average of a data set is found by adding all numbers in the data set and then dividing by the number of values in the set.

Mode: The mode is the value that appears most frequently in a data set.

Median: The median is a numeric value that separates the higher half of a set from the lower half. 

Relation b/w mean, mode and median:

Mode = 3(Median) - 2(Mean)

Calculation:

Given that,

mean of data = 4 and mode of  data = 10

We know that

Mode = 3(Median) - 2(Mean)

⇒ 10 = 3(median) - 2(4)

⇒ 3(median) = 18

⇒ median = 6

Hence, the median of data will be 6.

Test: Statistics - 1 - Question 11

A set of values is said to be relatively uniform if it has_______.

Detailed Solution for Test: Statistics - 1 - Question 11

Dispersion refers to the extent to which the values in a dataset are spread out or scattered around a central value. It is a measure of the variability or spread of the data points.

When a set of values is described as being relatively uniform, it means that the values are close to each other and do not vary greatly. In other words, there is little variability or spread among the values.

Low dispersion indicates that the data points are tightly clustered around a central value, such as the mean or median. This suggests that the values in the dataset are similar or have similar magnitudes, resulting in a more uniform distribution.

On the other hand, high dispersion refers to a dataset with values that are more spread out or widely scattered. This implies greater variability or differences among the data points.

Therefore, a set of values is said to be relatively uniform if it has low dispersion. The values are close to each other, indicating little variability or spread among the data points.

Test: Statistics - 1 - Question 12

What is the mean of the range, mode and median of the data given below?

5, 10, 3, 6, 4, 8, 9, 3, 15, 2, 9, 4, 19, 11, 4

Detailed Solution for Test: Statistics - 1 - Question 12

Given:

The given data is 5, 10, 3, 6, 4, 8, 9, 3, 15, 2, 9, 4, 19, 11, 4

Concept used:

The mode is the value that appears most frequently in a data set

At the time of finding Median

First, arrange the given data in the ascending order and then find the term

Formula used:

Mean = Sum of all the terms/Total number of terms

Median = {(n + 1)/2}th term when n is odd 

Median = 1/2[(n/2)th term + {(n/2) + 1}th] term when n is even

Range = Maximum value – Minimum value 

Calculation:

Arranging the given data in ascending order 

2, 3, 3, 4, 4, 4, 5, 6, 8, 9, 9, 10, 11, 15, 19

Here, Most frequent data is 4 so 

Mode = 4

Total terms in the given data, (n) = 15 (It is odd)

Median = {(n + 1)/2}th term when n is odd 

⇒ {(15 + 1)/2}th term 

⇒ (8)th term

⇒ 6 

Now, Range = Maximum value – Minimum value 

⇒ 19 – 2 = 17

Mean of Range, Mode and median = (Range + Mode + Median)/3

⇒ (17 + 4 + 6)/3 

⇒ 27/3 = 9

∴ The mean of the Range, Mode and Median is 9

Test: Statistics - 1 - Question 13

A symmetrical distribution has mean equal to 4. Its mode will be______.

Detailed Solution for Test: Statistics - 1 - Question 13

In a symmetrical distribution, the data is evenly distributed around the central value, resulting in a mirror image when the distribution is folded along its center. The mean, median, and mode are all equal in a perfectly symmetrical distribution.

Given that the mean is equal to 4 in this case, it implies that the values on both sides of the distribution are balanced and cancel each other out when calculating the mean. Therefore, the median will also be equal to 4 since it represents the center point that divides the distribution into two equal halves.

In a symmetrical distribution, there is no skewness or bias towards either side. Each value has an equal chance of being the most frequently occurring value, which is the mode. Since the distribution is symmetrical and the mean is 4, the mode will also be equal to 4.

In summary, in a symmetrical distribution with a mean equal to 4, the mode will be equal to 4.

Test: Statistics - 1 - Question 14

If mean is less than mode, the distribution will be__________.

Detailed Solution for Test: Statistics - 1 - Question 14

Skewness refers to the asymmetry or lack of symmetry in a distribution. It describes the extent to which the data points are skewed to the left or right of the central value.

When the mean is less than the mode, it indicates that the tail of the distribution is longer on the left side, pulling the mean towards the left. This implies that the distribution is negatively skewed, also known as left-skewed.

In a negatively skewed distribution, the tail extends towards the left side, while the bulk of the data is concentrated towards the right side. The mode represents the most frequently occurring value, and when it is greater than the mean, it suggests that the peak of the distribution is on the right side.

To visualize this, imagine a dataset representing the incomes of a group of individuals. If the distribution is negatively skewed and the mean is less than the mode, it means that there are a few individuals with extremely low incomes, which extends the tail towards the left. The majority of the individuals have higher incomes, which creates the peak or mode on the right side.

In summary, if the mean is less than the mode, the distribution will be negatively skewed. The tail of the distribution is longer on the left side, indicating a concentration of values towards the right side.

Test: Statistics - 1 - Question 15

The observations 4, 1, 4, 3, 6, 2, 1, 3, 4, 5, 1, 6 are outputs of 12 dices thrown simultaneously. If m and M are means of lowest 8 observations and highest 4 observations respectively, then what is (2m + M) equal to?  

Detailed Solution for Test: Statistics - 1 - Question 15

Calculation:

To find the value of (2m + M), where m is the mean of the lowest observations and M is the mean of the highest observations, we first need to determine the values of m and M.

Given the observations:

4, 1, 4, 3, 6, 2, 1, 3, 4, 5, 1, 6.

To find m, the mean of the lowest 8 observations,

We arrange the observations in ascending order and calculate the mean:

1, 1, 1, 2, 3, 3, 4, 4.

mean (m)

= (1 + 1 + 1 + 2 + 3 + 3 + 4 + 4) / 8
= 19 / 8

To find M, the mean of the highest 4 observations,

we arrange the observations in descending order and calculate the mean:

6, 6, 5, 4.

M = (6 + 6 + 5 + 4) / 4
= 21 / 4

Then (2m + M):

= 2×19/8 + 21/4

= 10

Therefore, (2m + M) is equal to 10.

Test: Statistics - 1 - Question 16

Which of the following is not a value of central tendency?

Detailed Solution for Test: Statistics - 1 - Question 16
  • The mode represents the most frequently occurring value,
  • The median is the middle value when the data is arranged in ascending or descending order, and
  • The mean is the average value calculated by summing all values and dividing by the number of values.
  • Mode, median, and mean, are all measures of central tendency.
  • The standard deviation is not a value of central tendency.
  • It is a measure of dispersion or variability in a dataset.

∴ Standard deviation is the required answer.

Test: Statistics - 1 - Question 17

The distribution in which mean = 60 and mode = 50, will be ________

Detailed Solution for Test: Statistics - 1 - Question 17

In a distribution, the mean, mode, and median are measures of central tendency that provide insights into the location or center of the data. However, they can have different values in different types of distributions.

Given that the mean is 60 and the mode is 50, it suggests that the majority of the values are below the mean but are concentrated around the mode. This situation typically occurs in positively skewed distributions, also known as right-skewed distributions.

In a positively skewed distribution, the tail extends towards the right side, while the bulk of the data is concentrated towards the left side. The mode represents the most frequently occurring value, and when it is lower than the mean, it indicates a concentration of values on the left side.

To illustrate this, imagine a dataset representing the ages of a group of people. If the distribution is positively skewed and the mean is higher than the mode, it implies that there are a few individuals with very high ages, which extends the tail towards the right. However, the majority of the individuals have lower ages, resulting in the mode being lower than the mean.

Therefore, based on the given information, the distribution in which the mean is 60 and the mode is 50 will most likely be positively skewed. The tail of the distribution is longer on the right side, indicating a concentration of values towards the left side.

Test: Statistics - 1 - Question 18

Which among the following are the measures of Central Tendency or Measures of Location?

A. Mean

B. Range

C. Mode

D. Median

E. Variance

Choose the most appropriate answer from the options given below:

Detailed Solution for Test: Statistics - 1 - Question 18

A. Mean: The mean is a measure of central tendency that represents the average value of a set of data. It is calculated by summing all the values in the dataset and dividing by the number of observations.

C. Mode: The mode is a measure of central tendency that represents the most frequently occurring value in a dataset. It is the value that appears with the highest frequency.

D. Median: The median is a measure of central tendency that represents the middle value in a dataset when it is arranged in ascending or descending order. It divides the dataset into two equal halves.

B. Range: The range is not a measure of central tendency. It is a measure of dispersion that represents the difference between the maximum and minimum values in a dataset. It provides information about the spread of the data but does not give insight into the central tendency.

E. Variance: The variance is not a measure of central tendency. It is a measure of dispersion that quantifies the spread of data points around the mean. It provides information about the variability of the dataset but does not directly represent the central tendency.

Therefore, the measures of central tendency or measures of location are A. Mean, C. Mode, and D. Median.

Test: Statistics - 1 - Question 19

The shape of symmetrical distribution is _______

Detailed Solution for Test: Statistics - 1 - Question 19

A symmetrical distribution, also known as a normal distribution or Gaussian distribution, has a bell-shaped curve. This shape is characterized by a smooth, symmetric, and unimodal pattern. The curve is highest at the center and tapers off towards the tails on both sides.

The bell-shaped curve is defined by its mean, which represents the center of the distribution, and its standard deviation, which determines the width or spread of the curve. In a perfectly symmetrical distribution, the mean, median, and mode are all located at the center of the curve.

The bell-shaped curve is a fundamental concept in statistics and probability theory. It is commonly observed in natural and social phenomena, where numerous independent factors contribute to the observed values. Examples of variables that often exhibit a bell-shaped distribution include heights, weights, test scores, and measurement errors.

The bell-shaped curve is significant because it allows for the application of many statistical methods and hypothesis tests that assume normality. Additionally, it provides a reference distribution against which other distributions can be compared or standardized.

Therefore, the shape of a symmetrical distribution is bell-shaped.

Test: Statistics - 1 - Question 20

If the mean of 5 observations x, x + 2, x + 4, x + 6 and x + 8 is 11, then the mean of last 3 observations is 

Detailed Solution for Test: Statistics - 1 - Question 20

Concept use:

Mean of the observation = Sum of the observations/ Total no of observations 

Calculations:

mean of 5 observations x, x + 2, x + 4, x + 6 and x + 8 is 11

⇒ mean of 5 observation = x + x + 2 + x + 4 + x + 6 + x + 8/ 5 = 5x + 20/5 = 11

⇒ mean of 5 observation = x + 4 = 11 

⇒  x = 7 

Mean of Last Observation = x + 4 + x + 6 + x + 8/ 3 = 3x + 18/3 = x + 6 = 7 + 6 = 13 

208 videos|138 docs|138 tests
Information about Test: Statistics - 1 Page
In this test you can find the Exam questions for Test: Statistics - 1 solved & explained in the simplest way possible. Besides giving Questions and answers for Test: Statistics - 1, EduRev gives you an ample number of Online tests for practice

Top Courses for UPSC

208 videos|138 docs|138 tests
Download as PDF

Top Courses for UPSC