JEE Exam  >  JEE Tests  >  Mathematics (Maths) for JEE Main & Advanced  >  Test: Statistics- 1 - JEE MCQ

Test: Statistics- 1 - JEE MCQ


Test Description

25 Questions MCQ Test Mathematics (Maths) for JEE Main & Advanced - Test: Statistics- 1

Test: Statistics- 1 for JEE 2025 is part of Mathematics (Maths) for JEE Main & Advanced preparation. The Test: Statistics- 1 questions and answers have been prepared according to the JEE exam syllabus.The Test: Statistics- 1 MCQs are made for JEE 2025 Exam. Find important definitions, questions, notes, meanings, examples, exercises, MCQs and online tests for Test: Statistics- 1 below.
Solutions of Test: Statistics- 1 questions in English are available as part of our Mathematics (Maths) for JEE Main & Advanced for JEE & Test: Statistics- 1 solutions in Hindi for Mathematics (Maths) for JEE Main & Advanced course. Download more important topics, notes, lectures and mock test series for JEE Exam by signing up for free. Attempt Test: Statistics- 1 | 25 questions in 25 minutes | Mock test for JEE preparation | Free important questions MCQ to study Mathematics (Maths) for JEE Main & Advanced for JEE Exam | Download free PDF with solutions
Test: Statistics- 1 - Question 1

A batsman scores runs in 10 innings 38,70,48,34,42,55,63,46,54 and 44, then the mean deviation is

Detailed Solution for Test: Statistics- 1 - Question 1

Arranging the given data in ascending order,
we have 34, 38, 42, 44, 46, 48, 54, 55, 63, 70
Here, Median M = (46+48)/2
=47
(∵ n = 10, median is the mean of 5th and 6th items)
∴ Mean deviation = ∑|xi−M|/n
=∑|xi−47|/10
= (13+9+5+3+1+1+7+8+16+23)/10
=8.6

Test: Statistics- 1 - Question 2

The S.D. of the observations 22,26,28,20,24,30 is

Detailed Solution for Test: Statistics- 1 - Question 2

μ = (22 + 26 + 28 + 20 + 24 + 30)/6
= 150/6 
= 25
x(i) = (xi - μ)2
x(22) = (22-25)2 = 9
x(26) = (26-25)2 = 1
x(28) = (28-25)2 = 9
x(20) = (20-25)2 = 25
x(24) = (24-25)2 = 1
x(30) = (30-25)2 = 25

(xi - μ)2  = 70
Standard deviation : [(xi - μ)2]/N
= (70/6)½
= 3.42

Test: Statistics- 1 - Question 3

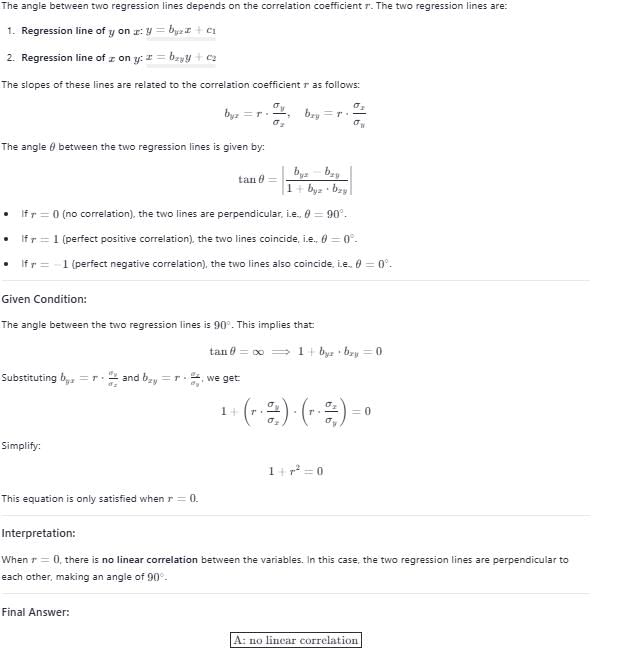
If the angle between two lines of regression is 900, then it represents

Detailed Solution for Test: Statistics- 1 - Question 3

Test: Statistics- 1 - Question 4

The two lines of regression are 2x - 7y + 6 = 0 and 7x – 2y +1 = 0. What is correlation coefficient between x and y ?

Detailed Solution for Test: Statistics- 1 - Question 4

ρ = (b(xy) * b(yx))
But sign of ρρ is same as sign of b(xy), b(yx)
Therefore, ρ = 2/7

Test: Statistics- 1 - Question 5

The two lines of regression are x + 4y = 3 and 3x +y = 15. value of x for y = 3 is

Detailed Solution for Test: Statistics- 1 - Question 5

Given lines are x+4y=3   (i) 
& 3x+y=15        (ii)
We first check which of the line (i) & (ii) is line of regression y
on x and x on y. Let line x+4y=3 be the line of regression x on y, then
other be the line of regression y on x.
∴ From (i) i.e. line of regression x on y we have x=−4y+3
∴ b(xy)=regression coefficient x on y=−4 and 3x+y=15
∴ y=−3x+15
∴ b(yx)=regression coefficient y on x=-3
Now count r2=b(yx)b(xy)=(−4)(−3)=12
⇒ ∣r∣=2(3)1/2
​which is not possible as 0≤r2≤1. So our assumption is wrong
and line x+4y=3 is line of regression y on x & 3x+y=15 is line of
regression x on y.
∴ 3x+y=15
⇒ x=(15−y)/3
⇒ x=(15−3)/3   (By putting y=3)
​= 4

Test: Statistics- 1 - Question 6

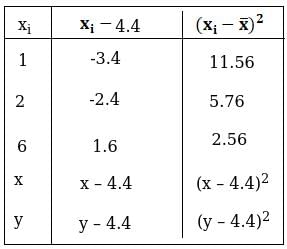
The mean of 5 observations is 4.4 and their variance is 8.24. If three observations are 1,2 and 6, the other two observations are

Detailed Solution for Test: Statistics- 1 - Question 6

Let the other nos. be a and b
then (x+y+1+2+6)/5 = 4.4
x + y = 13 ---------------------(1)
Variance = 8.24


41.2 = 19.88 + (x2 + 19.36 – 8.8x) + (y2 + 19.36 – 8.8y) 
21.32 = x2 + y2 + 38.72 – 8.8(x + y) 
x2 + y2 + 38.72 – 8.8(13) – 21.32 = 0 
(using equation (1)) 
x2 + y2 – 97 = 0 …(2) 
Squaring equation (1) both the sides, 
we get (x + y)2 = (13)^2 
x2 + y2 + 2xy = 169 
97 + 2xy = 169 
(using equation (2)) 
xy = 36 or x = 36/y (1)
⇒ 36/y + y = 13 
y2 + 36 = 13y 
y2 – 13y + 36 = 0 
(y – 4)(y – 9) = 0 
Either (y – 4) = 0 or (y – 9) = 0 
⇒ y = 4 or y = 9 
For y = 4 x = 36/y 
= 36/4 = 12 
For y = 9 
x = 36/9 
x = 4 
Thus, remaining two observations are 4 and 9.

Test: Statistics- 1 - Question 7

If x and y are related as y – 4x = 3, then the nature of correlation between x and y is

Detailed Solution for Test: Statistics- 1 - Question 7

The correlation between x and y is positive correlation because it is a correlation where if one variable increases, the other also increases, and if one variable decreases, the other also decreases.

Test: Statistics- 1 - Question 8

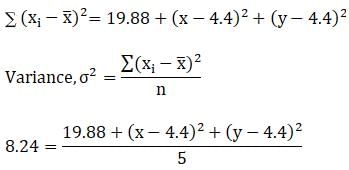
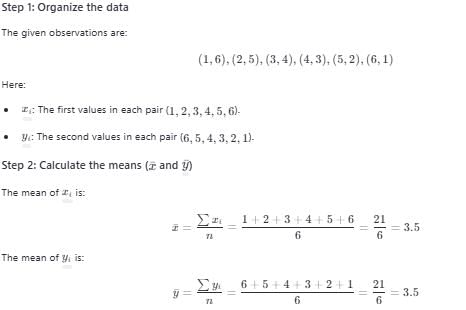
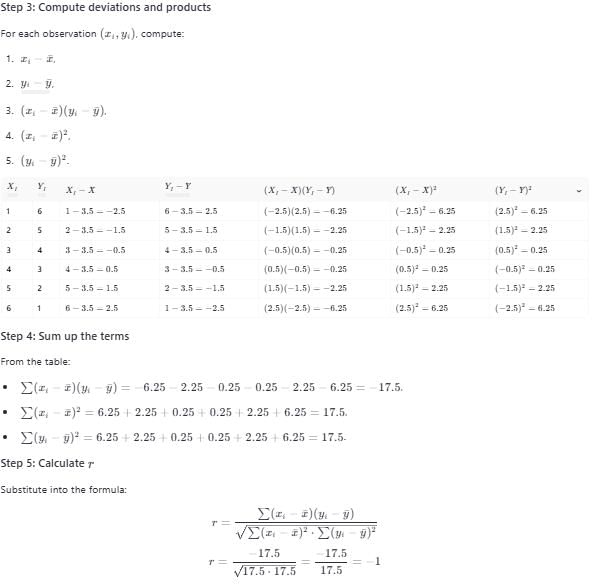
Coefficient of correlation between the observations (1, 6) , (2 , 5) , (3 , 4) , (4 , 3) , (5 , 2) , (6 , 1) is

Detailed Solution for Test: Statistics- 1 - Question 8


Test: Statistics- 1 - Question 9

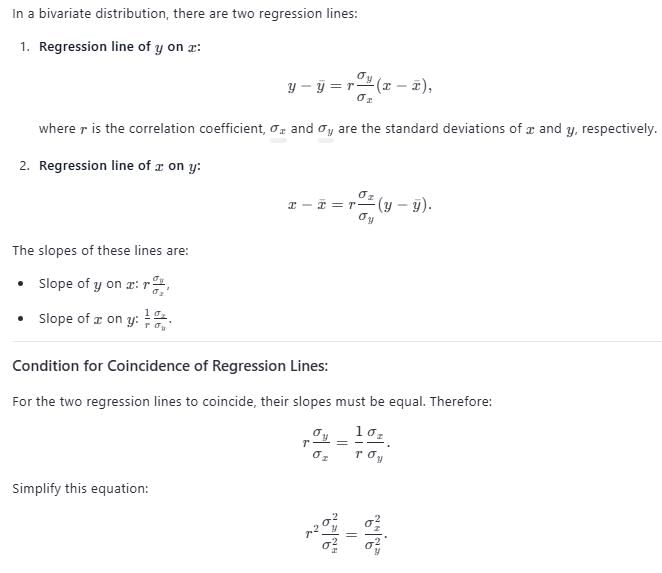
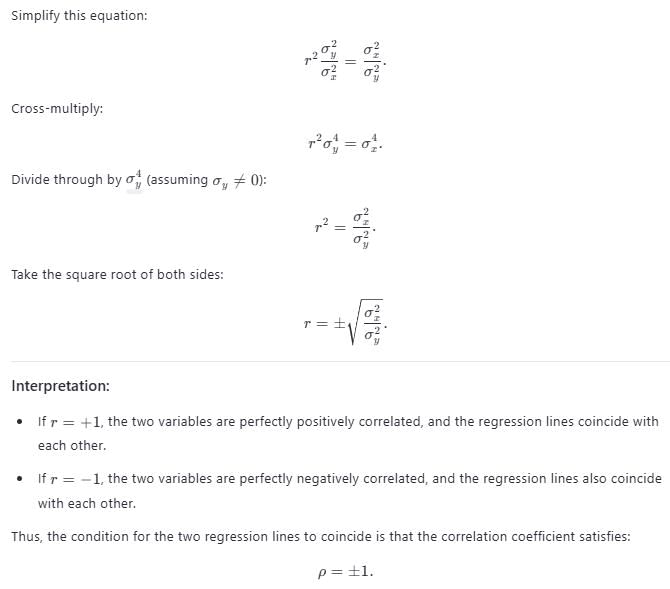
If the two lines of regression of a bivariate distribution coincide, then the correlation coefficient ρ satisfies.

Detailed Solution for Test: Statistics- 1 - Question 9


Test: Statistics- 1 - Question 10

For a moderately skewed distribution, quartile deviation and the standard deviation are related by

Detailed Solution for Test: Statistics- 1 - Question 10

The relationship between the mean, quartile and the standard deviation are as follows:
Mean Deviation is the mean of all the absolute deviations of a set of data.
Quartile deviation is the difference between “first and third quartiles” in any distribution.
Standard deviation measures the “dispersion of the data set” that is relative to its mean.
Mean Deviation = 4/5 × Quartile deviation
Standard Deviation = 3/2 × Quartile deviation

Test: Statistics- 1 - Question 11

Which one of the following average is most affected of extreme observations ?

Detailed Solution for Test: Statistics- 1 - Question 11
  • Arithmetic Mean (A.M.) : The arithmetic mean is calculated by summing all the observations and dividing by the number of observations. It is highly sensitive to extreme values (outliers) because every observation contributes directly to the sum, and extreme values can significantly skew the result.

  • Median : The median is the middle value when the data is arranged in ascending or descending order. It is not affected by extreme values because it only depends on the position of the values, not their magnitudes.

  • Mode : The mode is the most frequently occurring value in a dataset. Extreme observations do not affect the mode unless they change the frequency distribution significantly.

  • Geometric Mean (G.M.) : The geometric mean is calculated as the nth root of the product of n observations. While it is less sensitive to extreme values compared to the arithmetic mean, it is still more affected than the median or mode.
     

  • The arithmetic mean (A.M.) is the most affected by extreme observations.

    Thus, the correct answer is:

    D: A.M.​

Test: Statistics- 1 - Question 12

The H.M. of 4,8,16 is

Detailed Solution for Test: Statistics- 1 - Question 12

Test: Statistics- 1 - Question 13

The Mode of the following items is 0,1,6,7,2,3,7,6,6,2,6,0,5,6,0.

Detailed Solution for Test: Statistics- 1 - Question 13

To find the mode, we count how many times each number appears:

  • 0 appears 3 times.

  • 1 appears 1 time.

  • 6 appears 5 times.

  • 7 appears 2 times.

  • 2 appears 2 times.

  • 3 appears 1 time.

  • 5 appears 1 time.

Since 6 occurs the most frequently (5 times), the mode is 6.

Thus, the correct answer is:

D: 6

Test: Statistics- 1 - Question 14

The statistical method which helps us to estimate or predict the unknown value of one variable from the known value of the related variable is called

Detailed Solution for Test: Statistics- 1 - Question 14

The statistical method that allows us to estimate or predict the unknown value of one variable from the known value of a related variable is called regression.

Thus, the correct answer is:

B: regression

Test: Statistics- 1 - Question 15

The coefficient of correlation r satisfies

Detailed Solution for Test: Statistics- 1 - Question 15

Answer: A: |r| ≤ 1

Explanation:

The correlation coefficient (r) measures the strength and direction of the linear relationship between two variables. Its value always lies within the range -1 to +1, inclusive. This means:

  • If r = 1, there is a perfect positive linear relationship.

  • If r = 0, there is no linear relationship.

  • If r = -1, there is a perfect negative linear relationship.

Thus, the absolute value of r (|r|) satisfies |r| ≤ 1. This ensures that the correlation coefficient is always bounded within the interval [-1, 1].

Why other options are incorrect:

  • Option B (0 < r < 1): Incorrect because r can also take negative values (for example, -1 < r < 0).

  • Option C (|r| > 1): Incorrect because the correlation coefficient cannot exceed 1 in magnitude.

  • Option D (-1 < r < 0): Incorrect because r can also take positive values or be 0 or ±1.

Final Answer: A: |r| ≤ 1

Test: Statistics- 1 - Question 16

S.D. of a data is 6. When each observation is increased by 1, then the S.D. of new data is

Detailed Solution for Test: Statistics- 1 - Question 16

Answer: B: 6

Explanation: When a constant is added to every observation in a data set, the spread or dispersion of the data does not change. Therefore, adding 1 to each observation leaves the standard deviation unchanged.

Test: Statistics- 1 - Question 17

The most stable measure of central tendency is

Detailed Solution for Test: Statistics- 1 - Question 17

Answer: A: mean

Explanation: The mean is considered the most stable measure of central tendency because it takes into account every value in the data set. This results in it having a lower sampling variability compared to the median or mode, especially as the sample size increases.

Test: Statistics- 1 - Question 18

The mean weight of a group of 10 items is 28 and that of another group of n items is 35.The mean of combined group of 10 + n items is found to be 30. The value of n is

Detailed Solution for Test: Statistics- 1 - Question 18

Explanation: The total weight of the first group is 10 × 28 = 280. Let the number of items in the second group be n, so its total weight is 35 × n = 35n. For the combined group of (10 + n) items with a mean of 30, the total weight is 30 × (10 + n). Setting up the equation:

280 + 35n = 30 × (10 + n)

Expanding the right side gives:

280 + 35n = 300 + 30n

Subtracting 30n from both sides:

280 + 5n = 300

Subtracting 280 from both sides:

5n = 20

Dividing by 5:

n = 4

Test: Statistics- 1 - Question 19

The measure of variation which is least affected by extreme items is

Detailed Solution for Test: Statistics- 1 - Question 19

Answer: D: quartile deviation

Explanation: Quartile deviation, also known as the semi-interquartile range, is based on the quartiles of the data and is less influenced by extreme values. Unlike measures such as range, standard deviation, or mean deviation, quartile deviation focuses on the middle 50% of the data, making it a more robust measure of dispersion when extreme items are present.

Test: Statistics- 1 - Question 20

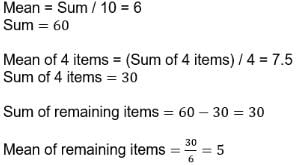
A group of 10 items has mean 6. If the mean of 4 of these items is 7.5, then the mean of the remaining items is

Detailed Solution for Test: Statistics- 1 - Question 20

Test: Statistics- 1 - Question 21

If the coefficient of variation between x and y is 0.28, covariance between x and y is 7.6, and the variance of x is 9, then the S.D. of the y series is

Detailed Solution for Test: Statistics- 1 - Question 21

Correlation coefficient = cov (x,y)/ (std deviation (x) ×std deviation (y))
Correlation coefficient  = 0.28
cov (x,y) = 7.6
variance of x is 9.  
=> std deviation (x) = √variance  of X = √9 = 3
=>  0.28  = 7.6 / ( 3 * std deviation (y))
=> std deviation (y) = 7.6 / ( 3 * 0.28)
=> std deviation (y) = 9.05
standard deviation of Y series = 9.05

Test: Statistics- 1 - Question 22

The Q.D. of the daily wages (in Rs) of 7 persons given below: 12,7,15,10,17,19,25 is

Detailed Solution for Test: Statistics- 1 - Question 22

To calculate the quartile deviation (Q.D.), follow these steps:

  1. Arrange the data in ascending order: 7, 10, 12, 15, 17, 19, 25

  2. Find the median (middle value). Since there are 7 data points, the median is the 4th value: Median = 15

  3. Divide the data into the lower and upper halves (excluding the median):

    • Lower half: 7, 10, 12

    • Upper half: 17, 19, 25

  4. Find the first quartile (Q1) which is the median of the lower half: Q1 = 10

  5. Find the third quartile (Q3) which is the median of the upper half: Q3 = 19

  6. Compute the quartile deviation using: Quartile Deviation = (Q3 - Q1) / 2 = (19 - 10) / 2 = 9 / 2 = 4.5

Thus, the Q.D. of the daily wages is 4.5, and the correct answer is:

A: 4.5

Test: Statistics- 1 - Question 23

Which of the following is not a measure of central tendency :

Detailed Solution for Test: Statistics- 1 - Question 23

Answer: C: range

Explanation: The mode, mean, and median are measures of central tendency that describe the central point of a data set. The range, on the other hand, measures the spread of the data and is a measure of dispersion, not central tendency.

Test: Statistics- 1 - Question 24

If the mean of numbers 27,31,89,107,156 is 82, then the mean of 130,126,68,50,1 is :

Detailed Solution for Test: Statistics- 1 - Question 24

Answer: A: 75

Explanation: To find the mean, add the numbers and then divide by the count. For the set 130, 126, 68, 50, 1:

  1. Calculate the sum: 130 + 126 + 68 + 50 + 1 = 375.

  2. Divide the sum by the number of items (5): 375 / 5 = 75.


Test: Statistics- 1 - Question 25

If in moderately asymmetrical distribution mode and mean of the data are 6 μ and 9 μ respectively, then median is

Detailed Solution for Test: Statistics- 1 - Question 25

Median = [mode + 2(mean)]/3
= [6μ+2(9μ)]/3
= 24μ/3
= 8μ

209 videos|447 docs|187 tests
Information about Test: Statistics- 1 Page
In this test you can find the Exam questions for Test: Statistics- 1 solved & explained in the simplest way possible. Besides giving Questions and answers for Test: Statistics- 1, EduRev gives you an ample number of Online tests for practice
Download as PDF