CAT Exam  >  CAT Tests  >  Test: Table Charts - CAT MCQ

Test: Table Charts - CAT MCQ


Test Description

10 Questions MCQ Test - Test: Table Charts

Test: Table Charts for CAT 2025 is part of CAT preparation. The Test: Table Charts questions and answers have been prepared according to the CAT exam syllabus.The Test: Table Charts MCQs are made for CAT 2025 Exam. Find important definitions, questions, notes, meanings, examples, exercises, MCQs and online tests for Test: Table Charts below.
Solutions of Test: Table Charts questions in English are available as part of our course for CAT & Test: Table Charts solutions in Hindi for CAT course. Download more important topics, notes, lectures and mock test series for CAT Exam by signing up for free. Attempt Test: Table Charts | 10 questions in 10 minutes | Mock test for CAT preparation | Free important questions MCQ to study for CAT Exam | Download free PDF with solutions
Test: Table Charts - Question 1

Directions: Read the table given below and answer the questions accordingly.
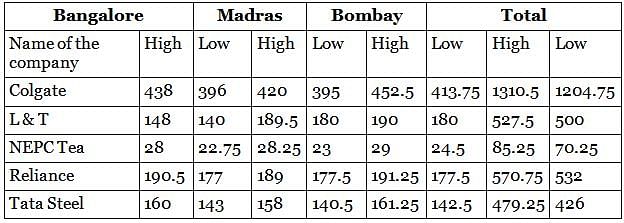
Q. For Reliance, the low rate of share is less than the average of the low rates of shares of the same company, in the Stock Exchange at

Detailed Solution for Test: Table Charts - Question 1

Average of low rates of shares of Reliance = (177.5+177.5+177) / 3> 177, which is the low rate of share of Reliance at Bangalore stock exchange. So, the correct option is 3.

Alternatively,
We know that, the city having the smallest value will be lesser than the average and the city having the largest value will be definitely more than the average. Using this logic, the answer can be marked as Bangalore.

Test: Table Charts - Question 2

Directions: Read the table given below and answer the questions accordingly.
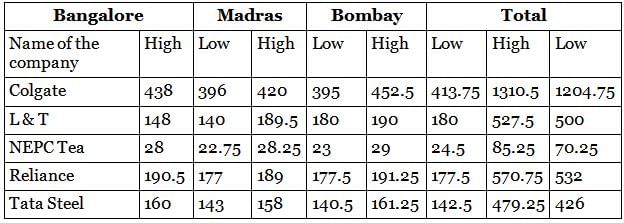
Q. The low rate of share in L & T at Madras Stock Exchange bears a ratio, to the total low rate of share of the same company, of

Detailed Solution for Test: Table Charts - Question 2

 Low rate of share of L & T at Madras Stock Exchange = Rs. 180.

Total of low rate of share of L & T in all three Stock Exchanges = Rs. 500.
Ratio of (i)/(ii)= 180/500 = 9/25. Hence, the answer is D option.

Test: Table Charts - Question 3

Directions: Read the table given below and answer the questions accordingly.
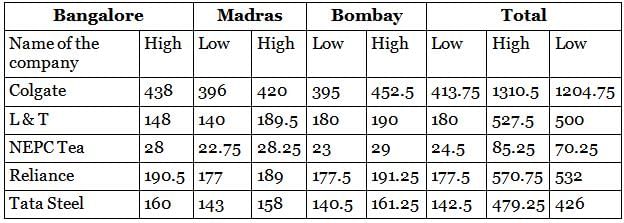
Q. The average of the high rates of share in all the three Stock Exchanges for NEPC Tea is

Detailed Solution for Test: Table Charts - Question 3

The last column is the total of all three stock exchanges (high rates and low rates, resp.) for every company. So, the average for NEPC high rates = 85.25/3= Rs. 28.42. Hence, the answer is 1st option.

Alternatively,
We know that, average has to lie somewhere in between the two extreme values. Here, the values are 28, 28.25 and 29. The second and third options are out of this range and fourth option is too close to the higher end. Thus, the only option left is the first one and hence, that is the answer.

Test: Table Charts - Question 4

Directions: Read the table given below and answer the questions accordingly.
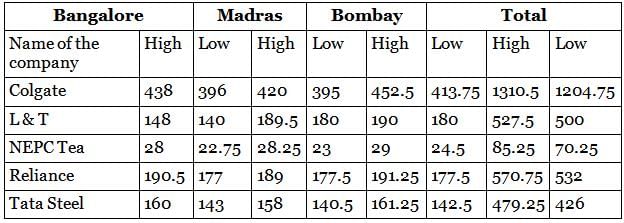
Q. For Tata Steel, the ratio of the high rate of share to the low rate is maximum in the Stock Exchange at

Detailed Solution for Test: Table Charts - Question 4

At Bangalore Stock Exchange, ratio of high rate to low rate = (160/143) = 1.11;
At Madras Stock Exchange, ratio of high rate to low rate = (158/140.5) = 1.12;
At Bombay Stock Exchange, ratio of high rate to low rate = (161.25/142.5) = 1.13.
As the maximum ratio is in Bombay, it will be the answer. Hence, the answer option is 3.

Test: Table Charts - Question 5

Directions: The following chart represents the Foreign Exchange Reserves in different year. Analyse carefully and answer that questions follows.
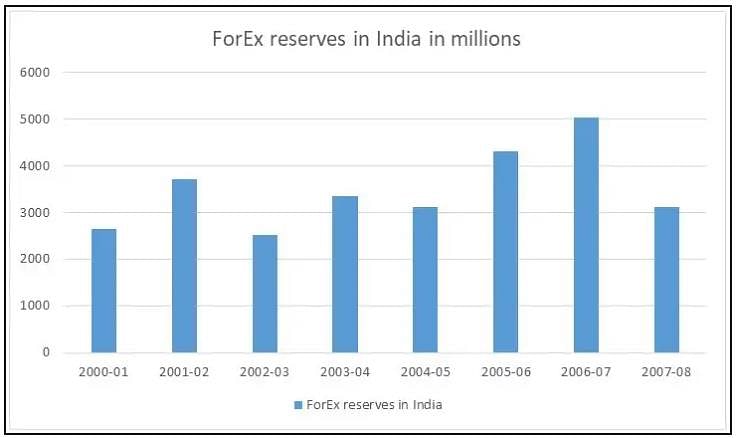
Q. The foreign exchange reserves in 2006-07 was how many times that in 2004-05?

Detailed Solution for Test: Table Charts - Question 5

This one is very simple one.
Forex in 2006-07 = 5000
Forex in 2004-05 = 3000 (nearest value)
The answer is 5000/3000 = 1.66 or almost 1.6

Test: Table Charts - Question 6

Directions: The following chart represents the Foreign Exchange Reserves in different year. Analyse carefully and answer that questions follows.
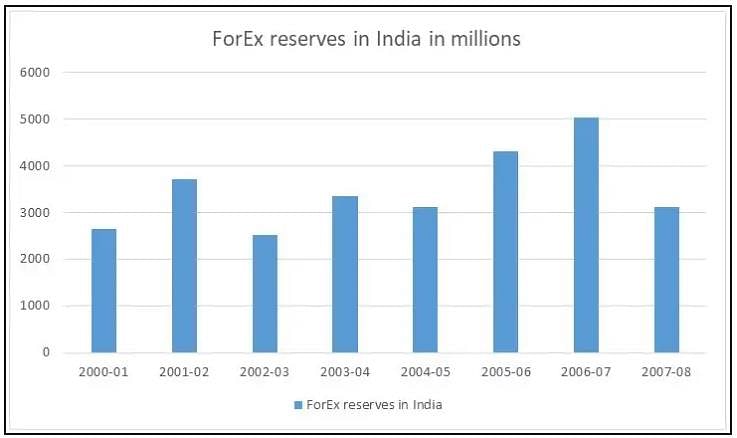
Q. The foreign exchange reserves in 2005-06 were approximately what percent of the average foreign exchange reserves over the period under review?

Detailed Solution for Test: Table Charts - Question 6

Average forex reserve is 3480. Forex Reserve in 2005-06 = 4320.
Hence, percentage = [4320/ 3480]* 100 = 124.14% = 125%

Test: Table Charts - Question 7

Directions: The following chart represents the Foreign Exchange Reserves in different year. Analyse carefully and answer that questions follows.
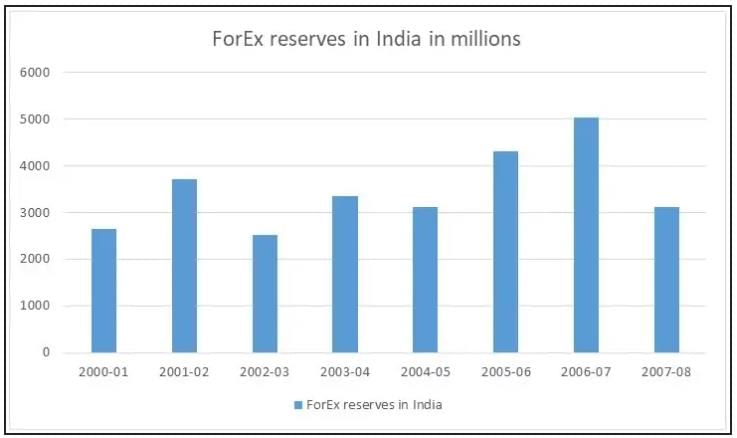
Q. The ratio of the number of years, in which the foreign exchange reserves are above the average reserves, to those in which the reserves are below the average reserves is?

Detailed Solution for Test: Table Charts - Question 7

In this case, we first need to find the average forex reserve and then find the ratio between the years when they are above the average and below the average.
Average Forex = (2640 + 3720 + 2520 + 3360 + 3120 + 4320 + 5040 + 3120) / 8 = 3480
Now, the years that are below the average = 2000-01, 2002-03, 2003-04, 2004-05, 2007-08
The years that are above the average = 2001-02, 2005-06, 2006-07
Hence, the ratio will be 3:5

Test: Table Charts - Question 8

Directions: The following chart represents the Foreign Exchange Reserves in different year. Analyse carefully and answer that questions follows.
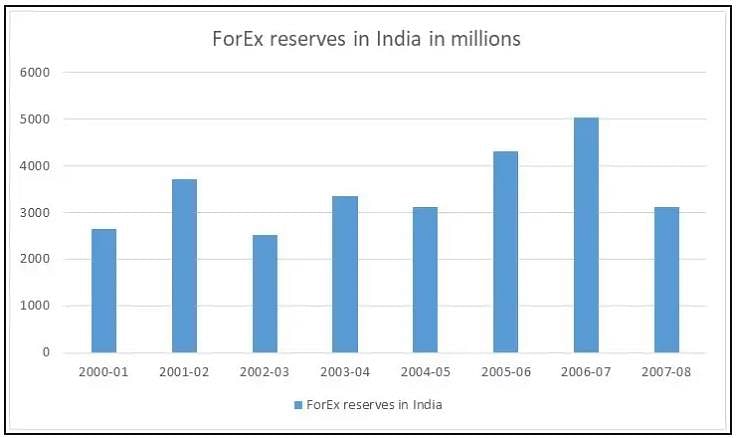
Q. For each year, the percent increase of foreign exchange reserves over the previous year, is the highest?

Detailed Solution for Test: Table Charts - Question 8

In this question we need to use percentages,
First the years in which forex rose compared to previous year = 2001-02, 2003-04, 2005-06, 2006-07
Percentage increase in these years compared to last year, 2001-02 = (3720 – 2640)/ 2640 * 100 = 40.9090%
2003-04 = (3360 – 2520)/ 2520 *100 = 33.33%
2005-06 = (4320 – 3120)/ 3120* 100 = 37.88%
2006-07 = (5040 – 4320) / 4320* 100 = 16.67%
Hence, the ans. Is 2001-02

Test: Table Charts - Question 9

Directions: The following chart represents the number of students of AMS careers at its Lucknow center who passed either the CAT exam or XAT exam or CET exam or none of these exams. (Assume that there are no students who passed more than one exam.)
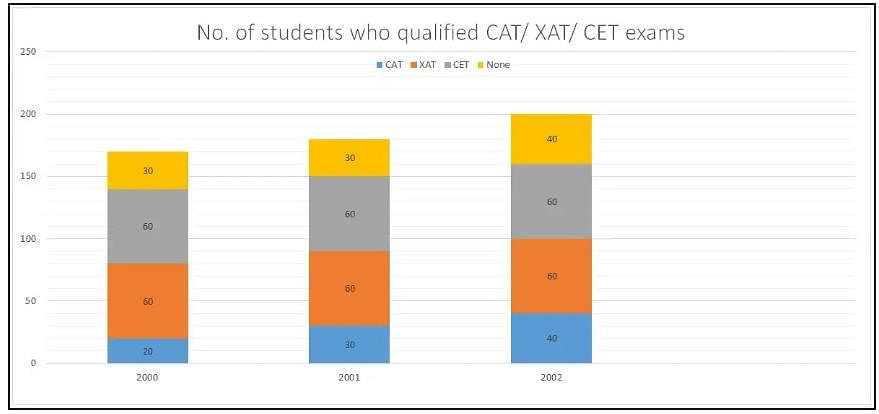
Q. What was the percentage of students who succeeded in at least one of the three exams in 2000?

Detailed Solution for Test: Table Charts - Question 9

Total students = 170
No. of students who are in none category = 30
Therefore, percentage of students who have cleared at least one = [(170 – 30) / 170] x 100 = 82.35%

Test: Table Charts - Question 10

Directions: The following chart represents the number of students of AMS careers at its Lucknow center who passed either the CAT exam or XAT exam or CET exam or none of these exams. (Assume that there are no students who passed more than one exam.)
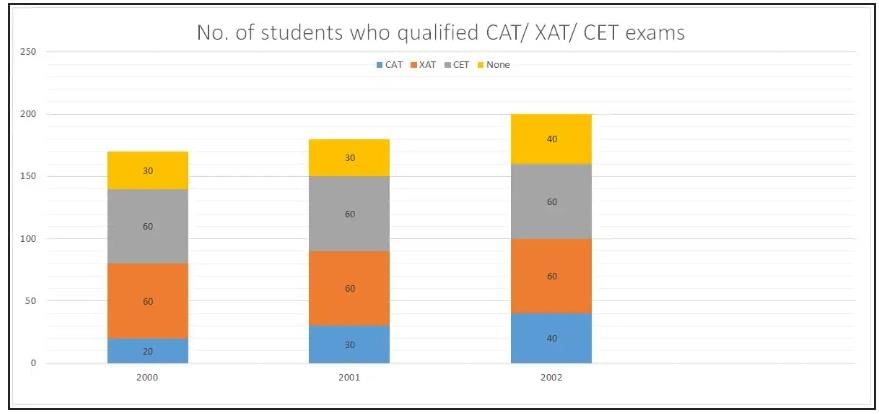
Q. What was the percentage of students who cleared CAT in 2000?

Detailed Solution for Test: Table Charts - Question 10

We need to calculate percentage of students who cleared CAT in 2000,
As shown above, there are 20 students who cleared CAT in 2000.
And, Total students are 170
Hence, 20/170 x 100 = 11.76%

Information about Test: Table Charts Page
In this test you can find the Exam questions for Test: Table Charts solved & explained in the simplest way possible. Besides giving Questions and answers for Test: Table Charts, EduRev gives you an ample number of Online tests for practice
Download as PDF