Civil Engineering (CE) Exam  >  Civil Engineering (CE) Tests  >  Transportation Engineering  >  Test: Traffic Engineering- 2 - Civil Engineering (CE) MCQ

Test: Traffic Engineering- 2 - Civil Engineering (CE) MCQ


Test Description

20 Questions MCQ Test Transportation Engineering - Test: Traffic Engineering- 2

Test: Traffic Engineering- 2 for Civil Engineering (CE) 2024 is part of Transportation Engineering preparation. The Test: Traffic Engineering- 2 questions and answers have been prepared according to the Civil Engineering (CE) exam syllabus.The Test: Traffic Engineering- 2 MCQs are made for Civil Engineering (CE) 2024 Exam. Find important definitions, questions, notes, meanings, examples, exercises, MCQs and online tests for Test: Traffic Engineering- 2 below.
Solutions of Test: Traffic Engineering- 2 questions in English are available as part of our Transportation Engineering for Civil Engineering (CE) & Test: Traffic Engineering- 2 solutions in Hindi for Transportation Engineering course. Download more important topics, notes, lectures and mock test series for Civil Engineering (CE) Exam by signing up for free. Attempt Test: Traffic Engineering- 2 | 20 questions in 60 minutes | Mock test for Civil Engineering (CE) preparation | Free important questions MCQ to study Transportation Engineering for Civil Engineering (CE) Exam | Download free PDF with solutions
Test: Traffic Engineering- 2 - Question 1

Which one of the following diagrams illustrates the relation between speed 'u' and density 'k' of traffic flow?

Detailed Solution for Test: Traffic Engineering- 2 - Question 1

At u = 0, 
k = kmax
u = umax k → 0
The curve (a) satisfies these conditions.
Curve (c) represents relation between density and volume of traffic.

Test: Traffic Engineering- 2 - Question 2

Which one of the following methods of O-D traffic surveys is conducted for comprehensive analysis of traffic and transportation data?

Detailed Solution for Test: Traffic Engineering- 2 - Question 2

Comprehensive analysis of traffic and transportation data require:
- Origin and destination in each zone
- Mode of transportation
- Number of vehicle and passengers in each vehicle
- Purpose of each trip
- Selection of route
- Length of trip
- Intermediate stops and their reason etc.
All this can be collected by Road side interview method.

1 Crore+ students have signed up on EduRev. Have you? Download the App
Test: Traffic Engineering- 2 - Question 3

The lost time due to starting delay on a traffic signal is noted to be 3s, the actual green time is 25s and yellow time is 3s. How much is the effective green time?

Detailed Solution for Test: Traffic Engineering- 2 - Question 3

Effective green time = Actual green time + Yellow time - lost time
= 25 + 3 - 3 
= 25 seconds

Test: Traffic Engineering- 2 - Question 4

In speed and delay study, if the average journey time on a stretch of road length of 3.5 km is 7.55 minutes and the average stopped delay is 1.8 minutes, the average running speed will be, nearly

Detailed Solution for Test: Traffic Engineering- 2 - Question 4

Average running time = Average journey time - Average stopped delay
= 7.55 - 1.8 
= 5.75 minutes
Average running speed = 

Test: Traffic Engineering- 2 - Question 5

If L is the length of vehicle in meters, C is the clear distance between two consecutive vehicles (Stopping sight distance), V is the speed of vehicles in km/hour; then the maximum number (N) of vehicles/hour is equal to

Detailed Solution for Test: Traffic Engineering- 2 - Question 5

Maximum number of vehicles per hour = 

Test: Traffic Engineering- 2 - Question 6

When the speed of the traffic flow becomes zero, then

Detailed Solution for Test: Traffic Engineering- 2 - Question 6

At zero speed density is maximum and volume is zero.

Test: Traffic Engineering- 2 - Question 7

It was noted that on a section of road, the free speed was 80 kmph and the jam density was 70 vpkm. The maximum flow in vph that could be expected on this road is

Detailed Solution for Test: Traffic Engineering- 2 - Question 7

Test: Traffic Engineering- 2 - Question 8

If the normal flows on two approach roads at an intersection are respectively 500 pcu per hr and 300 pcu per hr, the saturation flows are 1600 pcu per hr on each road and the total lost time per signal cycle is 16 s, then the optimum cycle time by Webster’s method is

Detailed Solution for Test: Traffic Engineering- 2 - Question 8

Optimum cycle time,

L = Total lost time per cycle = 16 sec 
Y = y1 + y2

∴ 

Test: Traffic Engineering- 2 - Question 9

When two roads with two-lane, two-way traffic, cross at an uncontrolled intersection, the total number of potential major conflict points would be

Detailed Solution for Test: Traffic Engineering- 2 - Question 9

An uncontrolled intersection is a junction where there are no traffic signals or signs to guide the drivers. In this case, we have two roads with two-lane, two-way traffic crossing each other. To determine the total number of potential major conflict points, we need to identify all the possible ways that vehicles coming from different directions can collide with each other.

Imagine standing at the center of the intersection. There are 4 approaches (North, South, East, and West), each with 2 lanes (one for each direction). When vehicles from these approaches enter the intersection, they can conflict with vehicles coming from the other 3 approaches.

For each approach, there are 4 possible left-turn conflicts, 4 right-turn conflicts, and 4 crossing conflicts. Let's break them down:

1. Left-turn conflicts: A vehicle turning left will need to yield to oncoming traffic and possibly conflict with vehicles coming from the opposite direction (4 possibilities), as well as vehicles coming from the left and right (4 possibilities). This gives us a total of 4 left-turn conflicts.

2. Right-turn conflicts: A vehicle turning right will need to watch out for traffic coming from the left (4 possibilities). This gives us a total of 4 right-turn conflicts.

3. Crossing conflicts: A vehicle going straight will need to be cautious of vehicles coming from the opposite direction (4 possibilities), as well as vehicles coming from the left and right (4 possibilities). This gives us a total of 4 crossing conflicts.

Now, to find the total number of potential major conflict points, we simply add these numbers together for each approach:

4 left-turn conflicts + 4 right-turn conflicts + 4 crossing conflicts = 12 major conflict points per approach

Since there are 4 approaches in total, we multiply this by 4:

12 major conflict points per approach x 4 approaches = 48 major conflict points

However, we have counted some conflicts twice (e.g., a left-turn conflict with a vehicle from the opposite direction is the same as that vehicle's crossing conflict). To account for this, we need to divide the total number of conflicts by 2:

48 major conflict points / 2 = 24 major conflict points

Finally, we need to subtract the 8 minor conflict points (4 left-turn conflicts and 4 right-turn conflicts) that are not considered major:

24 major conflict points - 8 minor conflict points = 16 potential major conflict points

So, there are a total of 16 potential major conflict points at an uncontrolled intersection where two roads with two-lane, two-way traffic cross.

Test: Traffic Engineering- 2 - Question 10

An Enoscope is used for measuring

Test: Traffic Engineering- 2 - Question 11

Matching List-I (Traffic flow characteristics) with Llst-ll (Figure/symbol) and select the correct answer using the codes given below the lists:
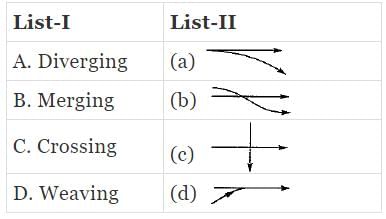
Codes:
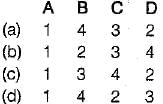
Test: Traffic Engineering- 2 - Question 12

The traffic conflicts that may occur in a rotary intersection are

Test: Traffic Engineering- 2 - Question 13

In which of the following traffic signal system are the cycle length and cycle division are automatically varied?

Detailed Solution for Test: Traffic Engineering- 2 - Question 13

Flexible progressive system (most efficient method of signalling).

Test: Traffic Engineering- 2 - Question 14

Matching List-I with List-Il and select the correct answer using the codes given below the lists: 
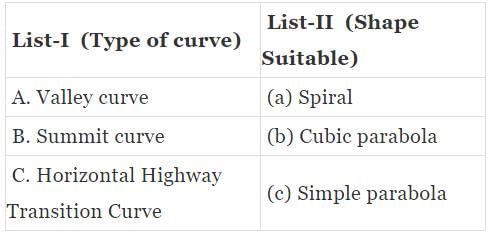
Codes:
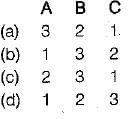
Test: Traffic Engineering- 2 - Question 15

Traffic volume is equal to

Test: Traffic Engineering- 2 - Question 16

With increase in speed of the traffic stream, the maximum capacity of the lane

Test: Traffic Engineering- 2 - Question 17

When the speed of traffic flow becomes zero, then

Test: Traffic Engineering- 2 - Question 18

The most efficient traffic signal system is

Test: Traffic Engineering- 2 - Question 19

A traffic rotary is justified where

Test: Traffic Engineering- 2 - Question 20

When a number of roads are meeting at a point and only one of the roads is important, then the suitable shape of rotary is

26 videos|91 docs|58 tests
Information about Test: Traffic Engineering- 2 Page
In this test you can find the Exam questions for Test: Traffic Engineering- 2 solved & explained in the simplest way possible. Besides giving Questions and answers for Test: Traffic Engineering- 2, EduRev gives you an ample number of Online tests for practice

Top Courses for Civil Engineering (CE)

26 videos|91 docs|58 tests
Download as PDF

Top Courses for Civil Engineering (CE)