UCAT Full Length Practice Test - 4 - UCAT MCQ
30 Questions MCQ Test - UCAT Full Length Practice Test - 4

Urban air mobility (UAM) uses electric vertical takeoff and landing (eVTOL) aircraft to ease urban congestion. In 2024, 60 UAM trials operated globally, with $3.5 billion invested. eVTOLs cut commute times by 45%, bypassing traffic. Safety concerns persist, with 15% of trials reporting minor accidents. Vertiport infrastructure costs $12 million each, hindering scalability. A 2023 study found that 65% of urban residents support UAM, but 50% worry about noise pollution. Battery range limits flights to 60 miles, and regulatory frameworks are incomplete. Singapore launched the first commercial UAM service in 2024, serving 12,000 passengers. Critics argue that UAM favors wealthy users, while supporters see it as future public transport. Low-income cities lack funding, and 70% of residents distrust safety claims. Public education campaigns are limited, with 55% unaware of UAM benefits. Innovations in battery technology are progressing slowly, delaying widespread adoption. (280 words)
Which city launched the first commercial UAM service in 2024?
Urban green spaces combat climate change by absorbing CO2 and reducing urban heat. In 2024, green spaces offset 5% of city emissions, saving 8 million tons of CO2 annually. They lower temperatures by 6°C, reducing air conditioning use by 15%. Maintenance costs $250 per square meter, limiting expansion. A 2023 study found 50% of green spaces use non-sustainable irrigation. Tokyo leads with 20% of buildings featuring green roofs. Community gardens boost biodiversity by 10%. Critics argue green spaces compete with housing needs, while supporters emphasize cooling benefits. Low-income areas have 35% less access, exacerbating inequality. Public awareness is low, with 70% of residents unaware of environmental benefits. Private funding covers 60% of projects, easing budget constraints. (290 words)
All green spaces use sustainable irrigation methods.

Urban green spaces foster social cohesion by providing areas for community interaction. In 2024, 25% of urban residents used parks weekly, boosting social ties by 20%. Green spaces host events, with 65% of cities offering free community programs. They improve air quality, reducing respiratory issues by 10%. Maintenance costs $220 per square meter annually, limiting expansion. A 2023 study found 55% of green spaces lack adequate lighting, affecting safety. New York leads with 30% of land as green spaces. Critics argue parks increase property taxes, while supporters highlight health benefits. Low-income areas have 45% less access, reducing equity. Public involvement in design is low, with 70% of residents uninvolved. Private donations fund 50% of projects, easing costs. (280 words)
All cities offer free community programs in green spaces.
Green spaces have eliminated respiratory issues in urban areas.
New York is the only city with significant green space coverage.
Which country leads in solar production?
What is a major challenge for renewable energy adoption?
Precision agriculture has eliminated pesticide use entirely.
What is a key benefit of autonomous vehicles?
Australia is the only country using precision agriculture globally.
What is a key benefit of precision agriculture?
Is it true that some Landscapes do not include trees?
Is it true that some Abstracts feature people?
Is it true that if a product has a keyboard, it cannot be a Smartphone?
Is it true that if a product is a Smartwatch, it has a touchscreen?
Is it true that some City packages include swimming?
Is it true that all Piano students read sheet music?
Groups of people from four generations (Gen Z, Millennials, Gen X, and Baby Boomers) were asked to what extent (on a scale of 1 to 7) they enjoyed playing table games and video games. Each person gave exactly one rating for each type of game. The graph shows the mean rating given by each generational group.
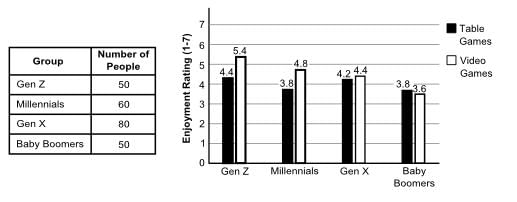
What is the average enjoyment rating for table games across all four generational groups?
Groups of people from four generations (Gen Z, Millennials, Gen X, and Baby Boomers) were asked to what extent (on a scale of 1 to 7) they enjoyed playing table games and video games. Each person gave exactly one rating for each type of game. The graph shows the mean rating given by each generational group.

What is the difference between the total enjoyment rating for table games given by Gen Z and Baby Boomers?
The table provides information about the ratios, by weight, of ingredients used to make different types of bread at a bakery. The total weight of each bread type is standardized to 1,000 grams.
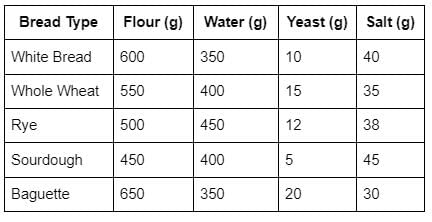
Which type of bread has the highest ratio of yeast to flour by weight?
The table shows the ticket prices for different attractions at a fair.
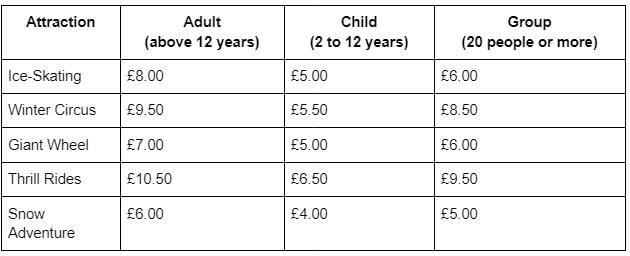
How much would a group of 25 people save if they buy group tickets for the Thrill Rides instead of individual adult tickets?
The table shows the ticket prices for different attractions at a fair.

What is the difference in cost between an adult ticket and a child ticket for the Snow Adventure?
The maximum capacity of a water tank in the shape of a rectangular prism is 18,000 litres. The length and width of the tank are both 3 metres each. What is the height of the tank?
0.001 cubic metre = 1 litre
How appropriate is the following response in this situation? Offer to swap seats with the passenger to resolve the issue.
How appropriate is the following response in this situation? Criticize the group for wasting time during the discussion.
How important is it to take the following action in this situation? Tell the client to wait patiently, as delays are common.
How appropriate is the following response in this situation? Contact affected attendees to apologize and offer alternative seating or a refund.


Important Questions for UCAT Full Length Practice Test - 4
UCAT Full Length Practice Test - 4 MCQs with Answers
Online Tests for UCAT Full Length Practice Test - 4
|
© EduRev
|
Education Revolution
|


|


