CA Foundation Exam  >  CA Foundation Tests  >  Quantitative Aptitude for CA Foundation  >  Test: Theoretical Distributions- 1 - CA Foundation MCQ

Test: Theoretical Distributions- 1 - CA Foundation MCQ


Test Description

30 Questions MCQ Test Quantitative Aptitude for CA Foundation - Test: Theoretical Distributions- 1

Test: Theoretical Distributions- 1 for CA Foundation 2025 is part of Quantitative Aptitude for CA Foundation preparation. The Test: Theoretical Distributions- 1 questions and answers have been prepared according to the CA Foundation exam syllabus.The Test: Theoretical Distributions- 1 MCQs are made for CA Foundation 2025 Exam. Find important definitions, questions, notes, meanings, examples, exercises, MCQs and online tests for Test: Theoretical Distributions- 1 below.
Solutions of Test: Theoretical Distributions- 1 questions in English are available as part of our Quantitative Aptitude for CA Foundation for CA Foundation & Test: Theoretical Distributions- 1 solutions in Hindi for Quantitative Aptitude for CA Foundation course. Download more important topics, notes, lectures and mock test series for CA Foundation Exam by signing up for free. Attempt Test: Theoretical Distributions- 1 | 40 questions in 40 minutes | Mock test for CA Foundation preparation | Free important questions MCQ to study Quantitative Aptitude for CA Foundation for CA Foundation Exam | Download free PDF with solutions
Test: Theoretical Distributions- 1 - Question 1

(Direction 1 - 40) Write down the correct answers. Each question carries 1 mark.

Q. A theoretical probability distribution. 

Detailed Solution for Test: Theoretical Distributions- 1 - Question 1

A theoretical probability is a probability number computed using an exact formula based on a mathematical theory or model.

Test: Theoretical Distributions- 1 - Question 2

Probability distribution may be

Detailed Solution for Test: Theoretical Distributions- 1 - Question 2

A probability distribution can be:

  • Discrete: This is when the random variable takes a finite or countably infinite number of values. For example, a die roll is a discrete random variable since it can take values 1, 2, 3, 4, 5, or 6.
  • Continuous: This is when the random variable can take any value within a certain range or interval, and the set of possible outcomes is uncountably infinite. For example, the height of a person is a continuous random variable, as it can take any value within a given range.

Therefore, the correct answer is D: both (a) and (b).

Test: Theoretical Distributions- 1 - Question 3

An important discrete probability distribution is

Detailed Solution for Test: Theoretical Distributions- 1 - Question 3

The Poisson distribution is a key concept in probability theory, particularly useful in various fields such as statistics, finance, and natural sciences. Here are its main features:

  • Definition: The Poisson distribution models the number of events occurring within a fixed interval of time or space, under the condition that these events happen with a known constant mean rate and independently of the time since the last event.
  • Applicability: It is particularly applicable for counting occurrences of events that are rare, such as:
    • Number of emails received in an hour
    • Occurrences of a specific disease in a population
    • Arrivals of customers at a store
  • Characteristics: Key characteristics of the Poisson distribution include:
    • Mean and variance are both equal to λ (lambda), which represents the average number of occurrences in the given interval.
    • The probability of observing k events is given by the formula: P(X = k) = (λ^k * e^(-λ)) / k!.
  • Graph: The probability mass function of the Poisson distribution typically shows a right-skewed shape, which gradually approaches a normal distribution as λ increases.

Overall, the Poisson distribution is a vital tool for modelling and understanding random events in various disciplines.

Test: Theoretical Distributions- 1 - Question 4

An important continuous probability distribution

Detailed Solution for Test: Theoretical Distributions- 1 - Question 4

Continuous probability distributions are essential in statistics and probability theory. They describe the likelihood of outcomes within a given range.

Among various types of continuous distributions, the following are notable:

  • Binomial distribution: This is a discrete distribution used for a fixed number of trials, each with two outcomes (success or failure).
  • Poisson distribution: It models the number of times an event occurs in a fixed interval of time or space. It is particularly useful for rare events.
  • Geometric distribution: This is another discrete distribution that represents the number of trials needed to achieve the first success.
  • Chi-square distribution: This is primarily used in hypothesis testing and is related to the distribution of sample variances.

In summary, while these distributions serve different purposes, they are fundamental to understanding statistical behaviour. The Chi-square distribution is noteworthy for its applications in various statistical tests.

Test: Theoretical Distributions- 1 - Question 5

Parameter is a characteristic of

Detailed Solution for Test: Theoretical Distributions- 1 - Question 5

A parameter is a characteristic that describes a specific group or population. Here are the key points regarding parameters:

  • A parameter represents a population, which includes all members of a specific group.
  • Parameters can also be derived from a sample, which is a subset of the population.
  • In statistics, a parameter quantifies aspects of a probability distribution, such as its mean or variance.
  • Therefore, a parameter is relevant to both the entire population and to samples taken from it.
Test: Theoretical Distributions- 1 - Question 6

An example of a parameter is

Detailed Solution for Test: Theoretical Distributions- 1 - Question 6

A parameter is a measurable factor that defines a characteristic of a population or a statistical model. Here are some common examples:

  • Sample mean: The average value of a sample, providing an estimate of the population mean.

  • Population mean: The average value of all members in a population, representing the true central tendency.

  • Binomial distribution: A statistical distribution that describes the number of successes in a fixed number of independent trials.

  • Sample size: The number of observations in a sample, crucial for determining the reliability of the results.

Test: Theoretical Distributions- 1 - Question 7

A trial is an attempt to

Detailed Solution for Test: Theoretical Distributions- 1 - Question 7

A trial is essentially an attempt to:

  • Produce an outcome that is uncertain.

  • It is not about making something impossible or solely prosecuting an offender.

In a broader sense, a trial can be viewed as:

  • A method to evaluate evidence and arguments in a legal setting.

  • A process where outcomes are determined based on the presentation of facts.

This highlights the fundamental nature of a trial as a means to seek the truth rather than merely achieving a definitive conclusion.

Test: Theoretical Distributions- 1 - Question 8

The important characteristic(s) of Bernoulli trials

Detailed Solution for Test: Theoretical Distributions- 1 - Question 8

Important Characteristics of Bernoulli Trials

  • Each trial has two possible outcomes, often referred to as "success" and "failure".

  • The trials are independent, meaning the outcome of one trial does not affect another.

  • The number of trials can be considered infinite, allowing for a consistent probability model.

In summary, the key characteristics of Bernoulli trials include both the independence of trials and the binary outcome nature.

Test: Theoretical Distributions- 1 - Question 9

The probability mass function of binomial distribution is given by

Detailed Solution for Test: Theoretical Distributions- 1 - Question 9

The probability mass function of a binomial distribution describes the likelihood of achieving a specific number of successes in a given number of trials. It can be expressed in different forms:

  • f(x) = px qn–x - This shows the probability of exactly x successes.
  • f(x) = ncxpx qn–x - This is the most commonly used form, where ncx represents the number of combinations of x successes in n trials.
  • f(x) = ncx qx pn–x - This form is less common but still valid.
  • f(x) = ncx pn–x qx - Another alternative representation.

In these formulas:

  • p represents the probability of success on a single trial.
  • q is the probability of failure, calculated as 1 - p.
  • n is the total number of trials.
  • x is the number of successful outcomes.

For a binomial distribution, the correct formula is the second one, which incorporates the combination factor to account for different ways x successes can occur in n trials.

Test: Theoretical Distributions- 1 - Question 10

If x is a binomial variable with parameters n and p, then x can assume

Detailed Solution for Test: Theoretical Distributions- 1 - Question 10

A binomial variable with parameters n and p can take on several possible values. Specifically, it can assume:

  • Any value from 0 to n.

  • All values including 0 and n.

  • Only whole numbers in the range from 0 to n, inclusive.

The key point is that a binomial variable only takes whole number values, making the possible outcomes:

  • 0 (no successes)

  • All the way up to n (maximum successes)

Thus, the correct description of the values a binomial variable can assume is any whole number between 0 and n, inclusive.

Test: Theoretical Distributions- 1 - Question 11

A binomial distribution is

Detailed Solution for Test: Theoretical Distributions- 1 - Question 11

A binomial distribution can exhibit different shapes depending on its parameters. Here are some key points:

  • A binomial distribution is symmetrical when the probability of success (p) is equal to 0.5.
  • If p is less than 0.5, the distribution is negatively skewed.
  • If p is greater than 0.5, the distribution is positively skewed.

In summary, the shape of a binomial distribution varies:

  • Symmetrical at p = 0.5
  • Negatively skewed for p < 0.5
  • Positively skewed for p > 0.5
Test: Theoretical Distributions- 1 - Question 12

The mean of a binomial distribution with parameter n and p is

Detailed Solution for Test: Theoretical Distributions- 1 - Question 12

The mean of a binomial distribution is calculated using the formula:

  • Mean (μ) = np

Where:

  • n is the number of trials.
  • p is the probability of success on each trial.

This formula indicates that the mean represents the expected number of successes in n trials.

For example, if you conduct 10 trials (n = 10) and the probability of success (p) is 0.5, the mean would be:

  • Mean (μ) = 10 * 0.5 = 5

This means that, on average, you can expect to achieve 5 successes in 10 trials.

Test: Theoretical Distributions- 1 - Question 13

The variance of a binomial distribution with parameters n and p is

Detailed Solution for Test: Theoretical Distributions- 1 - Question 13

Variance of a Binomial Distribution:

The variance of a binomial distribution, characterised by parameters n (the number of trials) and p (the probability of success), can be calculated using the formula:

  • Variance = np(1 - p)

Where:

  • n = number of trials
  • p = probability of success on each trial
  • 1 - p = probability of failure on each trial

This formula indicates that the variance increases with the number of trials and is affected by the probability of success. A higher probability of success leads to a lower variance, while a lower probability increases the variance.

Test: Theoretical Distributions- 1 - Question 14

An example of a bi-parametric discrete probability distribution is

Detailed Solution for Test: Theoretical Distributions- 1 - Question 14

A bi-parametric discrete probability distribution is characterised by two parameters that define its behaviour. Among the various types of distributions, the following are commonly discussed:

  • Binomial Distribution: This distribution models the number of successes in a fixed number of independent trials, each with the same probability of success. It is defined by two parameters: the number of trials (n) and the probability of success (p).
  • Poisson Distribution: This distribution is used to model the number of events occurring in a fixed interval of time or space, with a known constant mean rate and independent of the time since the last event. It is characterised by a single parameter, λ (lambda), which represents the average number of events in the given interval.

In summary, the binomial distribution fits the definition of a bi-parametric discrete probability distribution due to its reliance on two parameters, while the Poisson distribution does not. Therefore, the correct answer is the binomial distribution.

Test: Theoretical Distributions- 1 - Question 15

For a binomial distribution, mean and mode

Detailed Solution for Test: Theoretical Distributions- 1 - Question 15

In a binomial distribution, the mean and mode have specific relationships:

  • The mean is calculated as np, where n is the number of trials and p is the probability of success.

  • The mode, which is the most frequently occurring value, can be determined using the formula: floor((n + 1)p) or floor(np + p).

  • Generally, the mean and mode are not equal. However, they can be equal under specific conditions.

  • When the probability of success q is 0.50 (where q = 1 - p), the mean and mode can be equal.

Thus, in a binomial distribution:

  • The mean and mode are equal if q = 0.50.

  • They are not always equal under other circumstances.

Test: Theoretical Distributions- 1 - Question 16

The mean of binomial distribution is

Detailed Solution for Test: Theoretical Distributions- 1 - Question 16

The mean of a binomial distribution is a key concept in statistics.

The relationship between the mean, variance, and standard deviation in a binomial distribution is as follows:

  • The mean of a binomial distribution is calculated as n × p, where n is the number of trials and p is the probability of success.
  • The variance is calculated as n × p × (1 - p).
  • Generally, the mean will be greater than the variance when the probability of success is high (near 1). However, this may not always be the case for all values of p.
  • The standard deviation is the square root of the variance, making it a measure of spread in the distribution.

In conclusion, the statement that the mean is always more than its variance is not universally true. The relationship between these parameters can vary based on the values of n and p.

Test: Theoretical Distributions- 1 - Question 17

For a binomial distribution, there may be

Detailed Solution for Test: Theoretical Distributions- 1 - Question 17

In a binomial distribution, the number of modes can vary.

  • The distribution may have one mode, which is typical when the probabilities are balanced.
  • It can also have two modes in certain cases, especially when the probabilities of success and failure are not equal.

This means that:

  • In some scenarios, the mode occurs at a single value.
  • In other situations, there may be two peaks, indicating two most likely outcomes.

Therefore, the binomial distribution can demonstrate either:

  • A single mode (one peak) or
  • Two modes (two peaks).

In summary, the answer to how many modes a binomial distribution can have is that it can be one or two, depending on the parameters of the distribution.

Test: Theoretical Distributions- 1 - Question 18

The maximum value of the variance of a binomial distribution with parameters n and p is

Detailed Solution for Test: Theoretical Distributions- 1 - Question 18

The variance of a binomial distribution measures how much the outcomes deviate from the expected value. For a binomial distribution defined by parameters n (the number of trials) and p (the probability of success), the formula for variance is:

Variance = np(1 - p)

This formula indicates that:

  • n represents the total number of trials.
  • p is the probability of success on each trial.
  • (1 - p) reflects the probability of failure.

To find the maximum value of the variance:

  • Variance is maximised when p is equal to 0.5.
  • Substituting p = 0.5 into the variance formula gives:

Variance = n * 0.5 * (1 - 0.5) = n * 0.5 * 0.5 = n/4

Therefore, the maximum value of the variance for a binomial distribution occurs at:

  • n/4

This result confirms that the correct answer is n/4.

Test: Theoretical Distributions- 1 - Question 19

The method usually applied for fitting a binomial distribution is known as

Detailed Solution for Test: Theoretical Distributions- 1 - Question 19

The method typically used for fitting a binomial distribution is known as

  • Method of least squares: This technique minimizes the sum of the squares of the differences between observed and predicted values.

  • Method of moments: This approach uses sample moments (like mean and variance) to estimate distribution parameters.

  • Method of probability distribution: This refers to various methods that deal with the properties of probability distributions.

  • Method of deviations: This technique focuses on the deviations from expected values.

The most common method for fitting a binomial distribution is the method of moments. This method is straightforward and effective, especially when dealing with real data.

Test: Theoretical Distributions- 1 - Question 20

Which one is not a condition of Poisson model?

Detailed Solution for Test: Theoretical Distributions- 1 - Question 20

The Poisson model is a statistical method used to model the number of events occurring within a fixed interval of time or space. For this model to be valid, it must meet certain conditions. Here are the key conditions:

  • Constant probability: The chance of an event happening in a small time interval must remain constant.
  • Low probability of multiple events: The likelihood of more than one event occurring in a small time frame should be very low.
  • Independence: The occurrence of events in one interval must not influence the occurrence in another interval or previous intervals.
  • Linear probability: The probability of an event happening in a small interval should be proportional to the length of that interval.

Among these conditions, the statement that the probability of success in a small time interval is represented as kt for a positive constant k does not hold for the Poisson model. This implies that the probability changes with time, which contradicts the assumption of a constant probability.

Test: Theoretical Distributions- 1 - Question 21

Which one is uniparametric distribution?

Detailed Solution for Test: Theoretical Distributions- 1 - Question 21

Uniparametric distributions are statistical distributions characterised by a single parameter that defines their shape. Among the commonly discussed distributions, the following points highlight the nature of some distributions:

  • Binomial Distribution: This distribution requires two parameters: the number of trials and the probability of success. Therefore, it is not uniparametric.
  • Poisson Distribution: This distribution is defined by a single parameter, which is the average rate of occurrence. It models the number of events happening in a fixed interval of time or space. Thus, it is a uniparametric distribution.
  • Normal Distribution: This distribution is defined by two parameters: the mean and the standard deviation, making it not uniparametric.
  • Hypergeometric Distribution: Similar to the binomial distribution, it involves multiple parameters, such as the population size, the number of successes in the population, and the number of draws. Hence, it is also not uniparametric.

In summary, the Poisson distribution is the only one listed that qualifies as a uniparametric distribution.

Test: Theoretical Distributions- 1 - Question 22

For a Poisson distribution,

Detailed Solution for Test: Theoretical Distributions- 1 - Question 22

In a Poisson distribution:

  • The mean and variance are equal.

  • The standard deviation is the square root of the variance.

  • Thus, the standard deviation is less than the mean unless the mean is zero.

The key points regarding the Poisson distribution are:

  • Mean and variance are equal.
  • Standard deviation is not equal to the variance.

Therefore, the correct statement is that the mean and variance are equal.

Test: Theoretical Distributions- 1 - Question 23

Poisson distribution may be

Detailed Solution for Test: Theoretical Distributions- 1 - Question 23

The Poisson distribution is a probability distribution that is commonly used to model the number of events occurring within a fixed interval of time or space. It is characterised by its shape and can display different characteristics depending on the parameter used.

  • The distribution is typically unimodal, meaning it has a single peak.
  • In some cases, it may appear bimodal if the parameter is set appropriately, leading to two distinct peaks.
  • It can also be multi-modal under certain conditions, although this is rare.

Therefore, depending on the specific parameters and context, the Poisson distribution can exhibit:

  • Unimodal behaviour in most scenarios.
  • Bimodal characteristics in specific cases.

In summary, the Poisson distribution may be classified as either unimodal or bimodal based on its parameterisation.

Test: Theoretical Distributions- 1 - Question 24

Poisson distribution is

Detailed Solution for Test: Theoretical Distributions- 1 - Question 24

The Poisson distribution is a discrete probability distribution that expresses the probability of a given number of events occurring in a fixed interval of time or space. It is characterized by the following features:

  • The distribution is not symmetric; it is typically positively skewed.
  • The degree of skewness depends on the mean (λ) of the distribution.
  • As the mean increases, the distribution tends to become more symmetric.
  • However, it remains positively skewed for lower values of the mean.

In summary, the Poisson distribution is generally always positively skewed, particularly when the mean is low. Only when the mean approaches larger values does it start to resemble a normal distribution, reducing skewness.

Test: Theoretical Distributions- 1 - Question 25

A binomial distribution with parameters m and p can be approximated by a Poisson distribution with parameter m = np is

Detailed Solution for Test: Theoretical Distributions- 1 - Question 25

A binomial distribution can be approximated by a Poisson distribution under certain conditions. The key requirements for this approximation are:

  • m approaches infinity (m → ∝)
  • p approaches zero (p → 0)
  • The product of m and p remains finite (mp is constant)

This means that while the number of trials increases, the probability of success per trial decreases sufficiently to keep the overall mean constant. These conditions ensure that the binomial distribution behaves similarly to a Poisson distribution, which is especially useful for modelling rare events.

Test: Theoretical Distributions- 1 - Question 26

For Poisson fitting to an observed frequency distribution,

Detailed Solution for Test: Theoretical Distributions- 1 - Question 26

For Poisson fitting to an observed frequency distribution:

  • We set the Poisson parameter equal to the mean of the frequency distribution.

  • We do not equate the Poisson parameter to the median of the distribution.

  • We do not equate the Poisson parameter to the mode of the distribution.

  • None of the other options apply.

The correct approach for fitting a Poisson model is to use the mean of the observed data as the parameter. This ensures that the model accurately reflects the average rate of occurrences.

Test: Theoretical Distributions- 1 - Question 27

The most important continuous probability distribution is known as

Detailed Solution for Test: Theoretical Distributions- 1 - Question 27

A chi-square distribution is a continuous distribution with k degrees of freedom. It is used to describe the distribution of a sum of squared random variables. The normal distribution, which is continuous, is the most important of all the probability distributions. Its graph is bell-shaped. This bell-shaped curve is used in almost all disciplines. Since it is a continuous distribution, the total area under the curve is one.

Test: Theoretical Distributions- 1 - Question 28

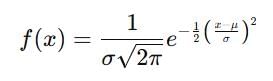
The probability density function of a normal variable x is given by

Detailed Solution for Test: Theoretical Distributions- 1 - Question 28

The probability density function (PDF) of a normal distribution is given by the formula:

Where:

  • μ is the mean of the distribution.
  • σ is the standard deviation.
  • x is the variable.

This formula is the correct representation of the PDF for a normal distribution. Option A correctly represents this formula.

Option B: contains an incorrect factor of 2σ2 in the denominator.

Option C: includes a misrepresentation of the formula, with an incorrect term for σ and other errors.

Option D: is incorrect since Option A is the correct representation.

Thus, Option A is the correct answer.

Test: Theoretical Distributions- 1 - Question 29

The total area of the normal curve is

Detailed Solution for Test: Theoretical Distributions- 1 - Question 29

The total area of a normal curve is one. This means that if you were to measure the entire area under the curve, it would equal 100%. Here are some key points to understand:

  • The normal curve represents a probability distribution.
  • It is symmetrical, with most values clustering around the mean.
  • The area under the curve corresponds to the total probability of all possible outcomes.
  • Since it accounts for all possible values, the area sums to one.

In summary, the normal curve is a fundamental concept in statistics, illustrating how probabilities are distributed in a population.

Test: Theoretical Distributions- 1 - Question 30

The normal curve is

Detailed Solution for Test: Theoretical Distributions- 1 - Question 30

The normal curve is a statistical representation of data that follows a specific distribution. It is characterised by the following features:

  • The shape resembles a bell, meaning it has a peak in the middle and tails off symmetrically on either side.
  • This shape indicates that most values cluster around the average, with fewer values appearing as you move away from the average.
  • The curve is important in statistics as it describes how data typically behaves in many natural and social phenomena.

Understanding the normal curve is essential for various applications, including:

  • Determining probabilities and making predictions based on statistical data.
  • Conducting hypothesis testing and creating confidence intervals.

In summary, the normal curve is a fundamental concept in statistics, represented as a bell-shaped curve that illustrates the distribution of data.

View more questions
114 videos|164 docs|98 tests
Information about Test: Theoretical Distributions- 1 Page
In this test you can find the Exam questions for Test: Theoretical Distributions- 1 solved & explained in the simplest way possible. Besides giving Questions and answers for Test: Theoretical Distributions- 1, EduRev gives you an ample number of Online tests for practice
Download as PDF