Test: Frequency Domain Analysis of Control Systems - 1 - Electrical Engineering (EE) MCQ
10 Questions MCQ Test GATE Electrical Engineering (EE) Mock Test Series 2026 - Test: Frequency Domain Analysis of Control Systems - 1
The Bode diagram approach is the most commonly used method for the analysis and synthesis of
Nichol's chart is a plot of
The initial slope of Bode plot for a transfer function having no poles at origin is
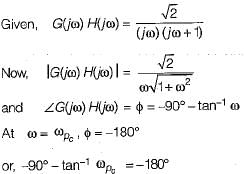
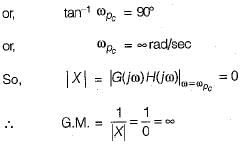
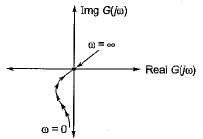
The gain margin of a control system having the loop transfer function G(s)H(s) = 
Gain crossover frequency is the frequency at which the gain of G(jω) is
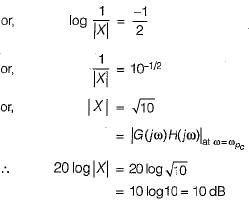
For a control system having gain margin of -10 dB, the magnitude of GH(s) for 180° phase shift is
A system with phase margin close to zero or gain margin close to unity is
If the transfer function of a first-order system in  then the time constant of this system will be
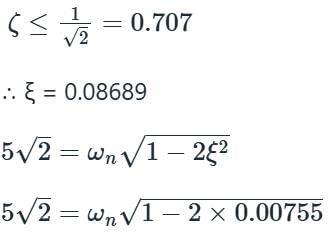
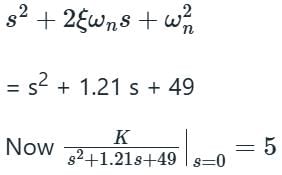
The magnitude of frequency response of an under-sampled second order system is 5 at 0 rad/sec and peaks to 10/√3 at 5√2 rad/sec. The transfer function of the system is
|
25 docs|247 tests
|
|
25 docs|247 tests
|


