Electrical Engineering (EE) Exam  >  Electrical Engineering (EE) Tests  >  Test: Nyquist Plot - 3 - Electrical Engineering (EE) MCQ

Test: Nyquist Plot - 3 - Electrical Engineering (EE) MCQ


Test Description

10 Questions MCQ Test - Test: Nyquist Plot - 3

Test: Nyquist Plot - 3 for Electrical Engineering (EE) 2024 is part of Electrical Engineering (EE) preparation. The Test: Nyquist Plot - 3 questions and answers have been prepared according to the Electrical Engineering (EE) exam syllabus.The Test: Nyquist Plot - 3 MCQs are made for Electrical Engineering (EE) 2024 Exam. Find important definitions, questions, notes, meanings, examples, exercises, MCQs and online tests for Test: Nyquist Plot - 3 below.
Solutions of Test: Nyquist Plot - 3 questions in English are available as part of our course for Electrical Engineering (EE) & Test: Nyquist Plot - 3 solutions in Hindi for Electrical Engineering (EE) course. Download more important topics, notes, lectures and mock test series for Electrical Engineering (EE) Exam by signing up for free. Attempt Test: Nyquist Plot - 3 | 10 questions in 30 minutes | Mock test for Electrical Engineering (EE) preparation | Free important questions MCQ to study for Electrical Engineering (EE) Exam | Download free PDF with solutions
Test: Nyquist Plot - 3 - Question 1

______indicates not only whether a system is stable, but also its degree of stability and how stability may be imposed if necessary.

Detailed Solution for Test: Nyquist Plot - 3 - Question 1

Nyquist plot:

  1. Nyquist plots are an extension of polar plots for finding the stability of the closed-loop control systems. This is done by varying ω from −∞ to ∞, i.e. Nyquist plots are used to draw the complete frequency response of the open-loop transfer function.
  2. In practice, it is not enough that a system is stable. There must also be some margins of stability that describe how stable the system is and its robustness. 
  3. There are many ways to express this, but one of the most common is the use of gain and phase margins, inspired by Nyquist’s stability criterion. 
  4. An increase in controller gain simply expands the Nyquist plot radially and an increase in the phase of the controller twists the Nyquist plot.
  5. Hence from the Nyquist plot, we can easily pick off the amount of gain or phase that can be added without causing the system to become unstable. Hence option (c) is the correct answer.

Method of drawing Nyquist plot:

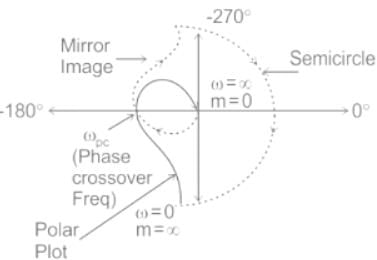
  • Locate the poles and zeros of the open-loop transfer function G(s)H(s) in the ‘s’ plane.
  • Draw the polar plot by varying ω from zero to infinity.
  • Draw the mirror image of the above polar plot for values of ω ranging from −∞ to zero.
  • The number of infinite radii half circles will be equal to the number of poles at the origin.
  • The infinite radius half-circle will start at the point where the mirror image of the polar plot ends. And this infinite radius half-circle will end at the point where the polar plot starts.

Test: Nyquist Plot - 3 - Question 2

The loop transfer function of a negative feedback system isThe Nyquist plot for the above system

Detailed Solution for Test: Nyquist Plot - 3 - Question 2

Concept:

Nyquist stability criterion:

N = P – Z

N is the number of encirclements of (-1+j0) point by the Nyquist contour in an anticlockwise direction.

P is the open-loop RHP poles

Z is the closed-loop RHP poles

Calculation:

Number of open loops RHP pole (P) = 1
Characteristic equation: 1 + G(s) H(s) = 0

⇒ s2 – 2s + 1 = 0

⇒ s = 1, 1

Number of closed loop RHP poles (Z) = 2

From Nyquist stability condition,

Number of encirclements N = P – Z = 1 – 2 = -1

Therefore, the Nyquist plot encircles (–1, 0) once in the clockwise direction.

1 Crore+ students have signed up on EduRev. Have you? Download the App
Test: Nyquist Plot - 3 - Question 3

The open loop transfer function of a unity feedback system is given byIn G(s) plane, the Nyquist plot of G(s) passes through the negative real axis at the point

Detailed Solution for Test: Nyquist Plot - 3 - Question 3


In G(s) plane, the Nyquist plot of G(S) passes through the negative real axis at the point (-a, j0)

a = magnitude of G(s) at ω = ωpc

ωpc is phase cross over frequency.

at ω = ωpc,∠G(jω) = −180

⇒ -0.25 ωpc – 90 = -180

⇒ ωpc = 2π

(-a, j0) = (0.5, j0)

Test: Nyquist Plot - 3 - Question 4

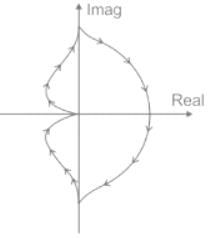
Consider a unity feedback system whose open loop transfer function isThe Nyquist plot for this system is

Detailed Solution for Test: Nyquist Plot - 3 - Question 4

Concept:

For standard transfer function:

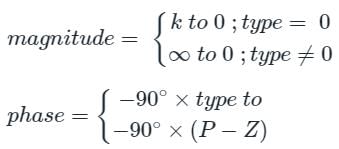
Nyquist plot = [Polar Plot] + [mirror image of polar plot w.r.t. x-axis but in opposite Direction] + [No. of semicircle of infinite radius in clockwise direction as many as type of system]

For ω(frequency) changing from 0 to ∞

Analysis:


Note: Above concept is only Valid for std. transfer function for Non-std. transfer function use the conventional method

Test: Nyquist Plot - 3 - Question 5

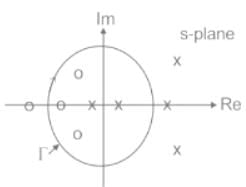
The pole-zero map of a rational function G(s) is shown below. When the closed contour Γ is mapped into the G(s)-plane, then the mapping encircles
Detailed Solution for Test: Nyquist Plot - 3 - Question 5

Concept:

Cauchy principles argument states that the closed contour Γ is mapped into the G(s)-plane will encircle the origin as many times as the difference between the number of poles (P) and zeros (Z) of the open-loop transfer function G(s) that are encircled by the S – plane locus Γ, i.e.

No. of encirclement is given by:

N = P – Z

Calculation:

The closed contour Γ of a pole-zero map of a rational function G(s) contains 2 poles and 3 zeros.

So, the number of encirclement will be:

N = P – Z

N = 2 – 3 = -1

Hence,

It encircles the origin once in the clockwise direction.

Another method to solve:

The closed contour Γ of a pole-zero map of a rational function G(s) is encircling 2 poles and 3 zeros in a clockwise direction, hence the corresponding G(s) plane contour encircles origin 2 times in anti-clockwise direction and 3 times in clockwise direction.

Hence, Effectively it encircles origin once in the clockwise direction.

Special note:

  • If we discuss the stability of the open-loop transfer function then we take encirclement around the origin.
  • If we discuss the stability of closed-loop transfer function then we take encirclement around

 -1 + j0. (∴ Option 3 and 4 are incorrect)

Test: Nyquist Plot - 3 - Question 6

For the transfer function G (jω) = 5 + jω, the corresponding Nyquist plot for positive frequency has the form

Detailed Solution for Test: Nyquist Plot - 3 - Question 6

G (jω) = 5 + jω

 ω = 0  

 G (jω) = 5 + j 0 

 ω = 10  

 G (jω) = 5 + j 10 

 ω = ∞ 

 G (jω) = 5 + j ∞ 

 ∴ G (jω) is a straight line parallel to jω axis

Test: Nyquist Plot - 3 - Question 7

The Nyquist stability criterion and the Routh criterion both are powerful analysis tools for determining the stability of feedback controllers. Identify which of the following statements is FALSE:

Detailed Solution for Test: Nyquist Plot - 3 - Question 7
  • Both Nyquist and RH criteria can be used to find the range of gain (k) for the system to be stable
  • Bode plot can be used to find the transfer function which further can be used to determine the Nyquist Plot.
  • RH criteria do not give accurate terms in case of exponential terms, an approximation can be obtained using exponential expansion up to 1st degree
  • Nyquist plots are the continuation of polar plots for finding the stability of the closed-loop control systems by varying ω from −∞ to ∞.

Derivation:

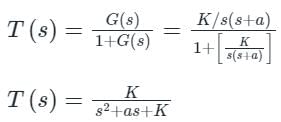
Let us consider O.L.T.F of a unity feedback system as:


This represents a type = 1 and order – 2 system for which the Nyquist plot will be as shown below:


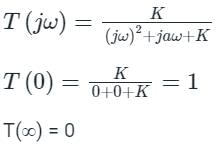
The closed-loop transfer function for the system is given as:

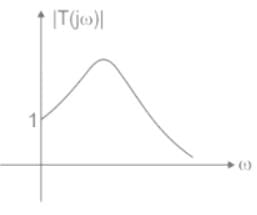
We can draw its Nyquist plot by simply substituting s = jω and obtain polar coordinates of T(jω) for different values of ω as:


So, the statement given in option (D) is false. 

Test: Nyquist Plot - 3 - Question 8

The Nyquist plot of the transfer functionDoes not encircle the point (–1 + j0) for K = 10 but does encircle the point (-1 + j0) for K = 100 . Then the closed-loop system (having unity gain feedback) is

Detailed Solution for Test: Nyquist Plot - 3 - Question 8

Concept:

For Nyquist stability

N = P

P = Number of open-loop poles in RHS of s-plane

N = Number of encirclement about the point (-1 + j0)

N = +ve for anticlockwise

N = -ve for clockwise enduement

Calculation:

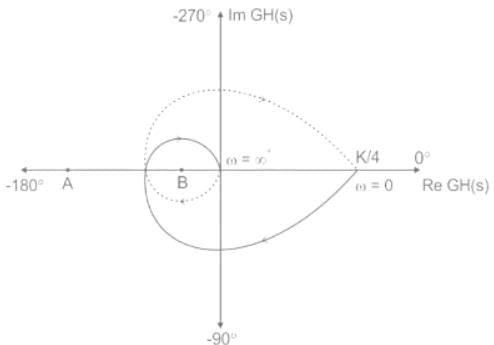
The polar plot is drawn as:


Let two points A and B representing -1 + j0 for different values of K,

The Nyquist plot is not encircling -1 + j 0 at A, i.e, K = 10

at B, the Nyquist plot is encircling -1 + j 0 i. e, K = 100

Let us now find the stability for K = 10 and K = 100 using Nyquist

Case: 1

K = 10

N = P - Z

Z = P - N

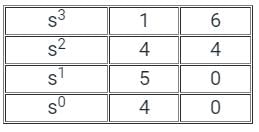
The Routh table can be drawn as follows:

No sign change, hence P = 0 and also N = 0

∴ Z = 0 → CLTP is stable

Case: 2

Z = P - N

N = -2 (two clockwise encirclement)

∴ Z = 2.

hence, CLTP is unstable.

Test: Nyquist Plot - 3 - Question 9

The complete Nyquist plot of the open-loop transfer function G(s) H(s) of a feedback control system is shown in the figure.
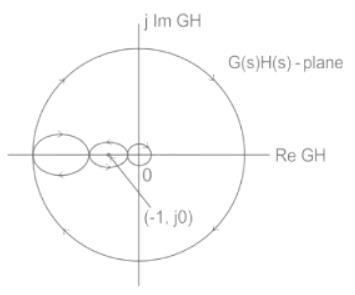
If G(s) H(s) has one zero in the right-half of the s-plane. the number of poles that the closed-loop system will have in the right-half of the s-plane is

Detailed Solution for Test: Nyquist Plot - 3 - Question 9

We will observe the encirclement around the origin: (for open loop transfer function → G(s)H(s)= 0 )

N = P - Z

where,

P = the no. of open-loop poles lie in the right half of plane

Z = the no. of closed-loop poles or open-loop zeros lie in the right half of plane

N = no. of encirclement about (-1 + j0) in G(S) H(S) plane

OR,

no. of encirclement about the origin in 1 + G(S) H(S) plane.

Given;

Z = 1 (for open loop system)

N = 2 (at the origin in ACW direction)

then

2 = P - 1

∴ P = 3 

For the analysis of closed loop system:

observe the encirclement around the (-1 , j0) [∵ 1 + GH = 0 → GH = -1]

N = 0

P = 3

Then,

N = P - Z

Z= P - N

∴ Z= 3 - 0 = 3

There are 3 poles in the right half-plane. 

Test: Nyquist Plot - 3 - Question 10

Which of the following is a powerful frequency-domain method of extracting the information regarding stability as well as the relative stability of a system without the need to evaluate the roots of the characteristic equation?

Detailed Solution for Test: Nyquist Plot - 3 - Question 10

Nyquist plot:

  • Nyquist plots are the continuation of polar plots for finding the stability of the closed-loop control systems by varying ω from −∞ to ∞.
  • It provides information regarding stability as well as the relative stability of a system without the need to evaluate the roots of the characteristic equation.

Nyquist stability criteria:

Encirclement:

  • A point (or) a region is encircled if it inside the closed path.
  • Encirclements(N) are considered as positive in the counter-clockwise direction and negative in a clockwise direction.


Nyquist stability criteria:

The Nyquist plot will encircle critical point (-1, j0) as many number of times as the difference between, the number of right side poles and zeros of the characteristic equation.

N = P - Z

Here

N = Number of encirclements of (-1, j0) by the Nyquist plot.

P = Number of right side poles of G(s) H(s)

Z = Number of right side zeros or roots of the characteristic equation (or) right side poles of the closed-loop transfer function.

For stability, 'Z' must be zero.

N = P -Z

N = P - 0

⇒ N = P

Hence, for closed-loop stability, NSC states that critical point (-1, j0) should be encircled in the counterclockwise direction as many numbers of times as the number of right side poles of G(s) H(s) by the Nyquist plot if the Nyquist contour is defined in the clockwise direction.
Note: For open-loop stable system P = 0, that means for closed-loop stability N = 0 - Z, for stability Z should be zero, it is possible if there are no encirclements made by Nyquist plot.

Information about Test: Nyquist Plot - 3 Page
In this test you can find the Exam questions for Test: Nyquist Plot - 3 solved & explained in the simplest way possible. Besides giving Questions and answers for Test: Nyquist Plot - 3, EduRev gives you an ample number of Online tests for practice

Top Courses for Electrical Engineering (EE)

Download as PDF

Top Courses for Electrical Engineering (EE)