Test: Data Handling - Class 5 MCQ
20 Questions MCQ Test Mathematics for Class 5: NCERT - Test: Data Handling

Direction: The given bar graph shows the number of residents in 6 cities. Study the graph and answer the question.

Q. There were 18 lacs residents residing in ____.
Q. There were 18 lacs residents residing in ____.
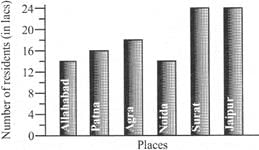
Direction: The given bar graph shows the number of residents in 6 cities. Study the graph and answer the question.
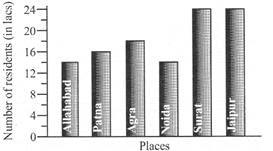
Q. How many more residents were residing in Surat than in Agra?
Q. How many more residents were residing in Surat than in Agra?

Direction: The given bar graph shows the number of residents in 6 cities. Study the graph and answer the question.
Q. How many residents were there altogether in the 6 cities?
Q. How many residents were there altogether in the 6 cities?
Direction: The given bar graph shows the number of viewers who watched the 4 channels. Study the graph and answer the question.
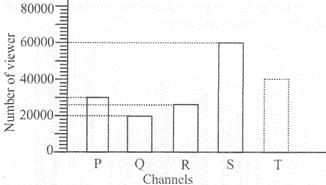
Q. How many more viewers watched Channel S than Channel Q?
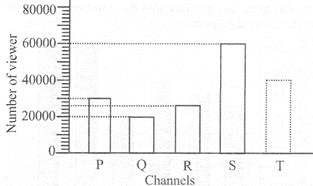
Direction: The given bar graph shows the number of viewers who watched the 4 channels. Study the graph and answer the question.
Q. There were 150000 viewers altogether. How many viewers watched Channel T?
Direction: The Sine graph shows the quantity of petrol Ankit used and the distance his car travelled. Study the graph answer the question.
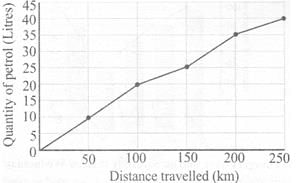
Q. How much less petrol was used for 100 km to 200 km travelled?
Direction: The Sine graph shows the quantity of petrol Ankit used and the distance his car travelled. Study the graph answer the question.
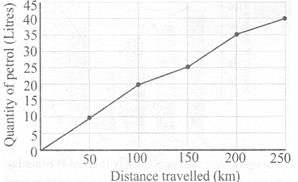
Q. What distance was travelled with 20 litres of petrol?
Direction: The Sine graph shows the quantity of petrol Ankit used and the distance his car travelled. Study the graph answer the question.
Q. What distance was travelled with 35 litres of petrol?
Direction: Study the graph and answer the question.
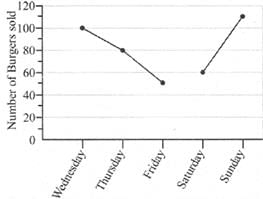
Q. How many lesser burgers were sold on Saturday than on Wednesday?
Direction: Study the graph and answer the question.
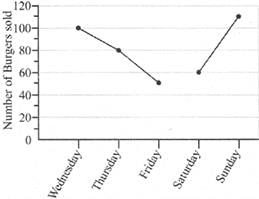
Q. The sum of the greatest number of burgers and the smallest number burgers sold is
Direction: Study the graph and answer the question.
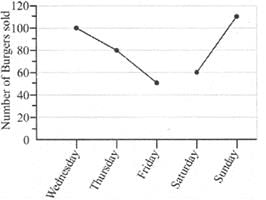
Q. If a profit of Rs. 12 was made for every burger sold, then how much profit was made on Thursday?
Direction: The bar graph shows the mass of 5 children.
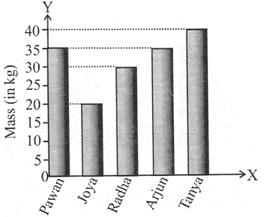
Q. What is the difference between the mass of the heaviest child and the lightest child?
Direction: The bar graph shows the mass of 5 children.
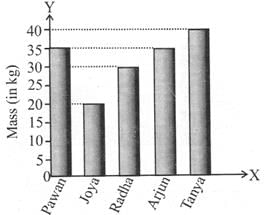
Q. Which of the two children have the same mass?
Direction: The bar graph shows the mass of 5 children.

Q. Who is 20 kg heavier than Joya?
Direction: The graph shows how Lalit spends his pocket money each month.
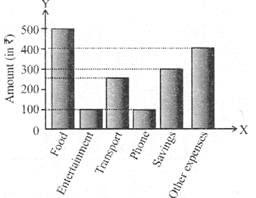
Q. The amount spent on food is how many times the amount spent on transport?
Direction: The graph shows how Lalit spends his pocket money each month.
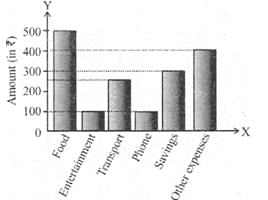
Q. What is the fraction of the amount spent on other expenses to the amount spent on food?
Direction: The graph shows how Lalit spends his pocket money each month.

Q. How much does Lalit earn per month?
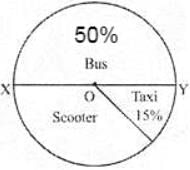
The pie-chart shows the modes of transport used by students of a school. XY is a straight line and O is the centre of the circle. What is the percentage of students who use scooter as a mode of transport?
Direction: The line graph shows the money earned by a fruit seller during a certain week.
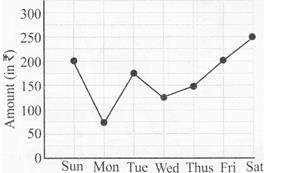
Q. On which day did he earn Rs.75 less than the amount earned on Thursday?
Direction: The line graph shows the money earned by a fruit seller during a certain week.
Q. What is the average amount earned from Monday to Thursday?
|
31 videos|286 docs|45 tests
|


Important Questions for Data Handling
Data Handling MCQs with Answers
Online Tests for Data Handling Mathematics for Class 5: NCERT
|
© EduRev
|
Education Revolution
|


|


