Test: Smart Charts - 1 - Class 5 MCQ
10 Questions MCQ Test - Test: Smart Charts - 1

Direction: The given bar graph shows the number of residents in 6 cities. Study the graph and answer the question.

Q. Which two cities have the most residents?
Direction: The given bar graph shows the number of residents in 6 cities. Study the graph and answer the question.
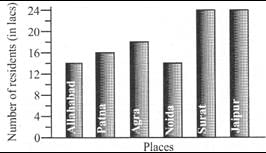
Q. Patna has more residents than _____

Direction: The given bar graph shows the number of residents in 6 cities. Study the graph and answer the question.
Q. How many residents were there altogether in the 6 cities?
Direction: The given bar graph shows the number of viewers who watched the 4 channels. Study the graph and answer the question.
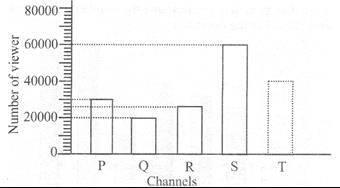
Q. Find out the number of viewers on Channel S and compare it with the number of users on Channel Q. What is the difference between the two?
Direction: The given bar graph shows the number of viewers who watched the 4 channels. Study the graph and answer the question.

Q. How many viewers watched channel P?
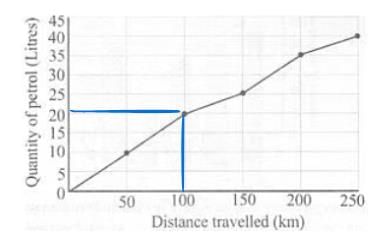
Direction: The Sine graph shows the quantity of petrol Ankit used and the distance his car travelled. Study the graph answer the question.

Q. What distance was travelled with 20 litres of petrol?
Direction: The Sine graph shows the quantity of petrol Ankit used and the distance his car travelled. Study the graph answer the question.

What distance was travelled with 25 litres of petrol?
Direction: The Sine graph shows the quantity of petrol Ankit used and the distance his car travelled. Study the graph answer the question.
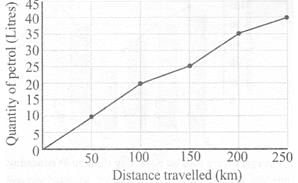
Q. What distance was travelled with 35 litres of petrol?
Direction: Study the graph and answer the question.
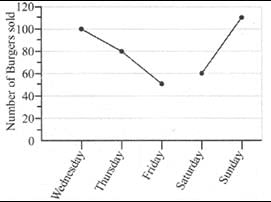
Q. How many burgers were sold on Thursday?
Direction: Study the graph and answer the question.

Q. Find the difference between the burgers sold on Wednesday and Saturday?
Important Questions for Smart Charts - 1
Smart Charts - 1 MCQs with Answers
Online Tests for Smart Charts - 1
|
© EduRev
|
Education Revolution
|


|


within 7 days!